CSSBB ASQ Certified Six Sigma Black Belt Free Practice Exam Questions (2026 Updated)
Prepare effectively for your ASQ CSSBB Certified Six Sigma Black Belt certification with our extensive collection of free, high-quality practice questions. Each question is designed to mirror the actual exam format and objectives, complete with comprehensive answers and detailed explanations. Our materials are regularly updated for 2026, ensuring you have the most current resources to build confidence and succeed on your first attempt.
A statistical process control chart is used primarily to
Which of the following examples represents an effective problem statement for a project team?
Which of the following expressions represents a half-fraction run for a two-level design with n factors?
A team would use a Gantt chart to
Which of the following techniques alerts a group leader or a team leader that there is a problem somewhere in their area?
A company that is selecting a Six Sigma project from four potential projects should select the one that
In a Weibull distribution, which of the following describes the shape parameter?
Creating a training plan to sustain an improved process will ensure that the new process
The primary reason for identifying both the internal and external customers of a process is to
Based on the chart comparing monthly performance of Facilities X and Y, which facility had the lower value in January and which had the lower value in February?
The Six Sigma project meeting attendees raised questions and concerns that would require additional discussion time. Which of the following should the meeting facilitator use to capture these items?
The following ANOVA table was developed for two factors, using a model that has no interaction term.
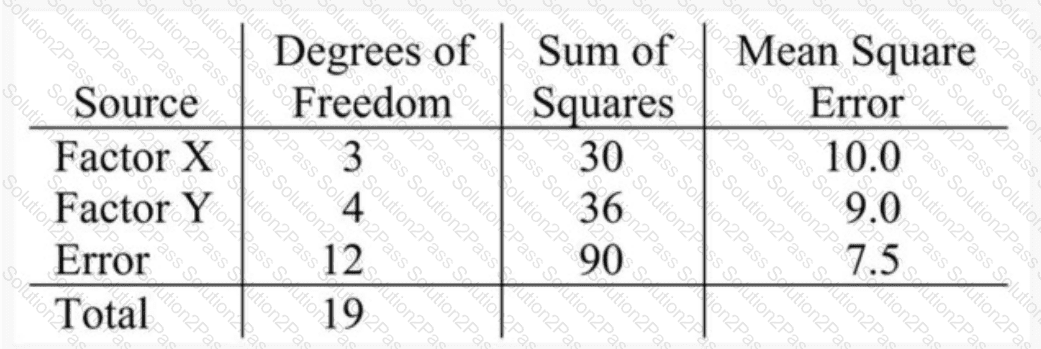
What is the value of the F statistic that should be used to determine whether Factor Y is statistically significant?
Which of the following is the primary benefit of single-minute exchange of dies (SMED)?
What is the primary benefit for using a statistical tolerance approach?
A process improvement team needs to determine whether there is a sufficient cost-benefit to warrant continuing a machine rebuild effort. Which of the following tools should the team use to make this decision?
Which of the following actions will support design for manufacturability (DFM)?
Which of the following sources of information is useful in facilitating interactions on a project team?
The primary purpose of a statistical process control chart is to
The process of requisitioning, ordering, and obtaining purchased material has been causing conflicts among three different departments. Representatives of each department have formed a cross-functional team to do process mapping to define all the elements of the process and to redesign the process as appropriate. The team has reached agreement on the flaws of the existing process based on the analysis of process data and clear process maps. The next logical step would be for the team to
The best method of reducing resistance to change is to
