Summer Sale Special - Limited Time 70% Discount Offer - Ends in 0d 00h 00m 00s - Coupon code: xmaspas7

Easiest Solution 2 Pass Your Certification Exams

500-420 Cisco AppDynamics Associate Performance Analyst (CAAPA) Free Practice Exam Questions (2026 Updated)

Prepare effectively for your Cisco 500-420 Cisco AppDynamics Associate Performance Analyst (CAAPA) certification with our extensive collection of free, high-quality practice questions. Each question is designed to mirror the actual exam format and objectives, complete with comprehensive answers and detailed explanations. Our materials are regularly updated for 2026, ensuring you have the most current resources to build confidence and succeed on your first attempt.

Page: 1 / 2
Total 124 questions

Which three data points can be located by drilling down into a JDBC exit call for an Oracle backend? (Choose three.)

A.

Query type

B.

Statement type

C.

Query Id

D.

Weight %

E.

Originating node

F.

%Time

What are two examples of backend calls? (Choose two.)

A.

a request coming from a browser

B.

a tier-to-tier request

C.

an asynchronous request

D.

a remote services call

Which option should a Performance Analyst use in an environment where virtual machines are routinely created and destroyed?

A.

Dappdynamics.agent.auto.node.prefix and -Dappdynamics.cron.vm

B.

Dappdynamics.agent.reuse.nodeName and - Dappdynamics.agent.reuse.nodeName.prefix

C.

Dappdynamics.http.proxyHost and -Dappdynamcs.http. proxy User

D.

Dappdynamics.agent.node.metainfo and -Dappdynamics.agent.nodeName

If a user request results in the discovery of an entry point, what is the one key item that must be defined as one or more asynchronous activities are spawned?
A.

Business Transaction

B.

Custom Endpoint

C.

Asynchronous Metric

D.

Endpoint Metrics

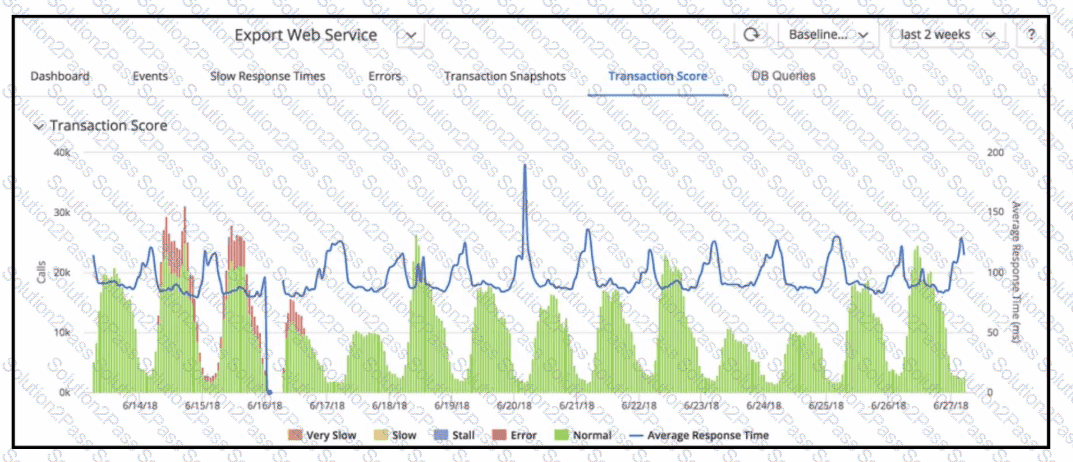
Refer to the exhibit. When looking at the Transaction Score for a specific transaction, how are errors in the transaction identified?

A.

Set the time range and drill down into the snapshots in the Error tab.

B.

Set the time range and examine the Slow Response Times tab.

C.

Set the time range and examine the dashboard for errors.

D.

Set the time range and drill down into the snapshots in the Events tab.

Which statement is true for shared AppDynamics Dashboards?

A.

Users are required to log in to their AppDynamics account and be inside the organization network.

B.

Users are required to have administrator access to the Controller.

C.

Users are not required to be logged in to their AppDynamics account.

D.

Users are required to log in to their AppDynamics account.

A Performance Analyst has enabled Development Level Monitoring for an application. For a default configuration, in which scenario will Development Level Monitoring get automatically disabled?

A.

A maximum of 500 calls per minute limit is exceeded, and Maximum heap utilization percentage goes above 90%

B.

A maximum of 1500 calls per minute limit is exceeded, and Maximum heap utilization percentage goes above 90%

C.

A maximum of 1000 calls per minute limit is exceeded, and Maximum heap utilization percentage goes above 95%

D.

A maximum of 2000 calls per minute limit is exceeded, and Maximum heap utilization percentage goes above 95%

Periodic Snapshot thresholds can be configured at which two levels? (Choose two.)

A.

Application

B.

Tier

C.

Service Endpoint

D.

Node

E.

Individual Transaction

Which two Key Performance Indicators (KPIs) accurately provide insight into server-level resource consumption? (Choose two.)

A.

Calls per Minute

B.

Availability

C.

Memory Used%

D.

Average Response Time

E.

Application Restarts

F.

CPU %Busy

Which three programming languages are supported by the AppDynamics Application Performance Monitoring solution? (Choose three.)

A.

Go Language

B.

Perl

C.

C/C++

D.

React

E.

iOS Family

F.

C#

Which feature can be used to determine if a given Java class is visible in AppDynamics?

A.

Tools in Business Transaction Discovery Session

B.

Preview Business transactions in Business Transaction Discovery Session

C.

Use the thread dump feature on the node agent

D.

Use the object instance tracking feature in memory

Which two methods are used to plot Host CPU and GC Time Spent in a single view? (Choose two.)

A.

Server tab under " Tiers and Nodes "

B.

JMX tab under " Tiers and Nodes "

C.

Memory tab under Tier and Nodes "

D.

Metrics Browser

Which option, in addition to " minutes since creation " , would a Performance Analyst use while configuring Automatic Cleanup of stale Business Transactions?

A.

Transaction Type

B.

Number of Calls

C.

Regular Expression

D.

Class/Method Filter

Which format is used to archive dashboard metadata?

A.

Dashboard metadata can be archived as a PDF.

B.

Dashboard metadata can be archived as a CSV.

C.

Dashboard metadata can be archived as an XLSX.

D.

Dashboard metadata can be archived as JSON.

What are two types of Data Collectors in AppDynamics APM? (Choose two.)

A.

SQL data collectors

B.

HTTP data collectors

C.

Remote Service invocation data collectors

D.

Method invocation data collectors

Which three Key Performance Indicators (KPIs) are automatically collected when you create an Information Point without adding custom data? (Choose three.)

A.

Minimum Response Time

B.

Response Time

C.

CPU Time

D.

Errors per Minute

E.

Calls per Minute

F.

Maximum Response Time

Which view allows a Performance Analyst to visualize a single aggregated value representing all of a server’s CPU, memory, disk, and network I/O utilization?
A.

The Application Dashboard

B.

The Tiers and Nodes – Health tab

C.

The Tiers and Nodes – Hardware tab

D.

The Metric Browser

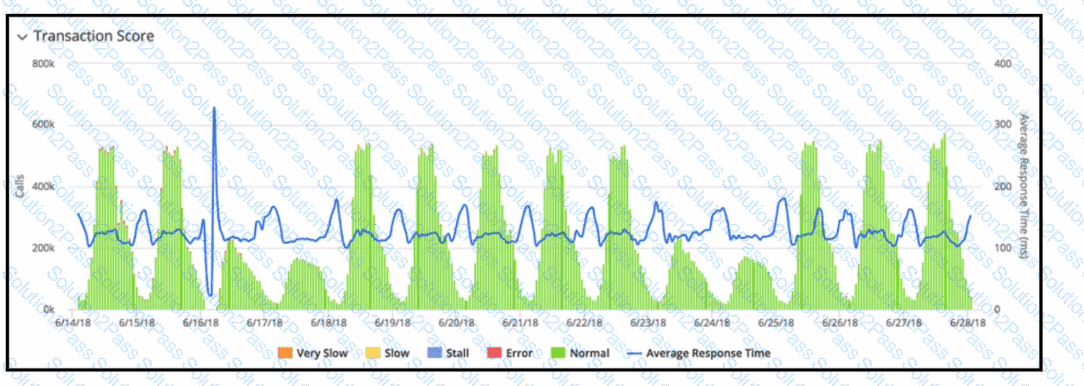
Refer to the exhibit. The transaction score in the graphic displays an interesting performance pattern outside of business hours on 6/16/18. Which additional performance anomaly should be of most interest to a Performance Analyst?

A.

Elevated Response Time at 6/19/18

B.

Elevated Response Time at 6/25/18

C.

Lower than usual volume at 6/17/18

D.

Low volume at 6/15/18

A Performance Analyst has noticed a significant decrease in an application ' s workload (calls/min) and is trying to identify the root cause. Which option will give the Performance Analyst insight into the behavior of the affected Business Transactions?

A.

Review Business Transactions and enable Show Trends

B.

In Metric Browser Plot Calls/min for the Application

C.

Review Top Business Transactions by Load in the Application Dashboard

D.

Review the Transaction Score for the Application

E.

Review all elements in the Application Flow Map and identify variations in load

A Performance Analyst needs to define a special database Key Performance Indicator (KPI). Which menu options should be used?

A.

Databases > Metric Browser > Add

B.

Applications > Configuration > Instrumentation

C.

Databases > Configuration > Custom Metrics

D.

Applications > Configuration > Slow Transaction Thresholds

Page: 1 / 2
Total 124 questions
Copyright © 2014-2026 Solution2Pass. All Rights Reserved