DA0-001 CompTIA Data+ Certification Exam Free Practice Exam Questions (2026 Updated)
Prepare effectively for your CompTIA DA0-001 CompTIA Data+ Certification Exam certification with our extensive collection of free, high-quality practice questions. Each question is designed to mirror the actual exam format and objectives, complete with comprehensive answers and detailed explanations. Our materials are regularly updated for 2026, ensuring you have the most current resources to build confidence and succeed on your first attempt.
Analytics reports should follow corporate style guidelines.
Which of the following are reasons to create and maintain a data dictionary? (Choose two.)
A data analyst is setting up a data dashboard to monitor several ETL data streams to ensure that data is complete for later analysis. Which of the following audiences should the analyst target for this dashboard?
An analyst is currently working on a ticket for revamping a company-wide dashboard that has been in use for five years. Which of the following should be the first step in the development process?
A data analyst has removed the outliers from a data set due to large variances. Which of the following central tendencies would be the best measure to use?
An analyst in a consumer bank department wants to showcase the concentration of accounts opened in the United States by ZIP Code to describe the effectiveness of the bank's marketing campaigns. Which of the following would be the best way to visualize the data?
Which of the following is the best technique for transferring data from one database to another with some data manipulation?
Which of the following statements would be used to append two tables that have the same number of columns?
A data analyst is performing a data merge within a spreadsheet using the tables below:
https://www.bing.com/images/blob?bcid=S1XCF9p02M4GjpbGxHj0lrIaj9sw.....4c 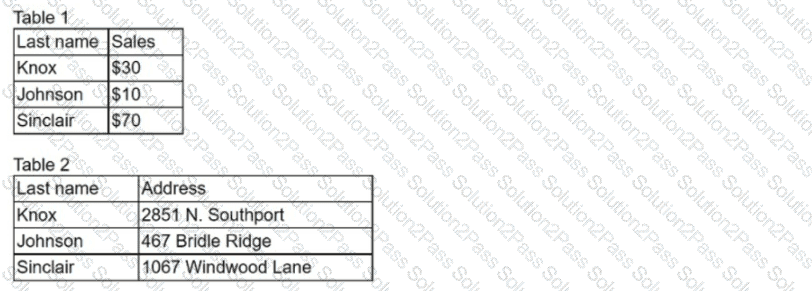
The analyst is attempting to pull the addresses from Table 2 into Table 1 using the last names and is receiving an error message. Which of the following steps can the analyst perform to fix the error?
A customer's telephone number is in the format 123-456-7890. Which of the following data types is used for the phone number?
Which of the following is an example of PII?
Which of the following should be accomplished NEXT after understanding a business requirement for a data analysis report?
An analyst is currently working on a ticket to revamp a company-wide dashboard that has been in use for five years. Which of the following should be the first step in the development process?
The senior management team at a company receives a detailed sales report at the end of each quarter. The report is several pages long and includes data from dozens of offices across the country. The team wants a better way to get a quick snapshot of what is included in the report. Which of the following modifications would best meet this requirement?
Which of the following actions should be taken when transmitting data to mitigate the chance of a data leak occurring? (Choose two.)
Which of the following is the best reason for removing data outliers?
Which one of the following is a common data warehouse schema?
Which of the following would a data analyst look for first if 100% participation is needed on survey results?
Which of the following best describes a business analytics tool with interactive visualization and business capabilities and an interface that is simple enough for end users to create their own reports and dashboards?
Python
An analyst needs to conduct a quick analysis. Which of the following is the FIRST step the analyst should perform with the data?
