KX3-003 Kinaxis Certified RapidResponse Author Level 3 Exam Free Practice Exam Questions (2026 Updated)
Prepare effectively for your Kinaxis KX3-003 Certified RapidResponse Author Level 3 Exam certification with our extensive collection of free, high-quality practice questions. Each question is designed to mirror the actual exam format and objectives, complete with comprehensive answers and detailed explanations. Our materials are regularly updated for 2026, ensuring you have the most current resources to build confidence and succeed on your first attempt.
You are asked to report data based on the ScheduledReceipt table that also displays information from a custom table, WorkOrderInfo. There will be at most one WorkOrderInfo record for any ScheduledReceipt record and WorkOrderInfo will be used often in worksheets reporting ScheduledReceipt data.
Following Kinaxis best practices, what should you do to accomplish this task?
You have a crosstab, bucketed worksheet that shows forecast records. There are forecast records on the first workday of every month for 18 months from the Planning Date. The bucket settings are set for 52 Weeks from the Planning Date. You want to improve performance for this worksheet, but still display it as a crosstab worksheet. You also want to display one year's worth of forecast records.
How would you accomplish this task?
You remove an automation chain step that runs in parallel with two other steps.
What is the result of this action?
You need to create a new custom field to be used for record filtering that will be populated with the salesperson's name. Each order will have a single associated salesperson's name.
Following database design principles and Kinaxis best practices, which action accomplishes this task?
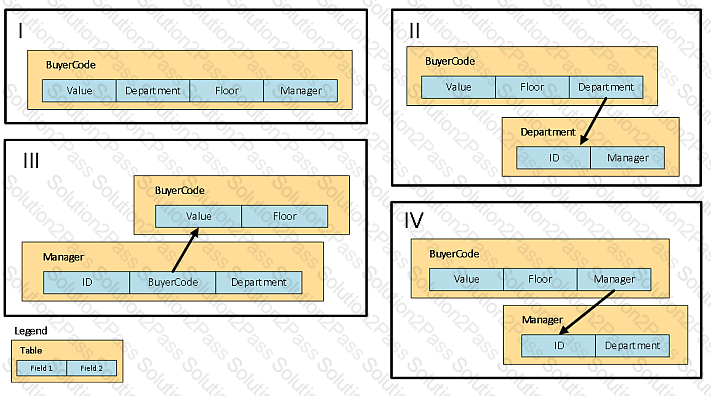
You want to define a custom data structure connecting BuyerCode to additional information: Manager, Department, and Floor. A manager might be responsible for more than one department. You expect that users will want to filter this information on combinations of each of those data elements.
Referring to the graphic, which data model structure should you use?
You are creating an insert definition to insert records using a crosstab worksheet, which contains weekly buckets that begin on Monday. You want the inserted records to be due on Friday of that week but if Friday is a non-workday, you want the inserted record to be due on Thursday.
In this situation, how would you set the bucket date in the insert definition?
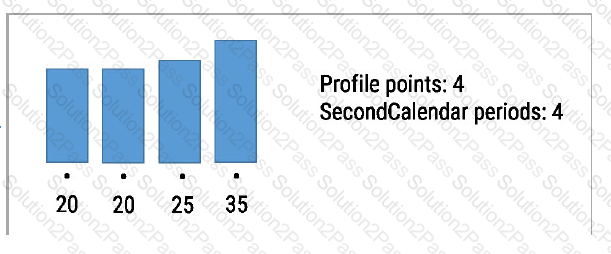
Forecasts are being received on a monthly basis and you are asked to spread these forecasts into weekly intervals. The month has four weeks, and you are using the spreading profile shown in the graphic where the first week is on the left. The monthly forecast is for a quantity of 500. The PlanningCalendars.ForecastCalendar=Month and PlanningCalendars.SecondCalendar=Week.
Referring to the graphic, what will the weekly forecast quantities be?
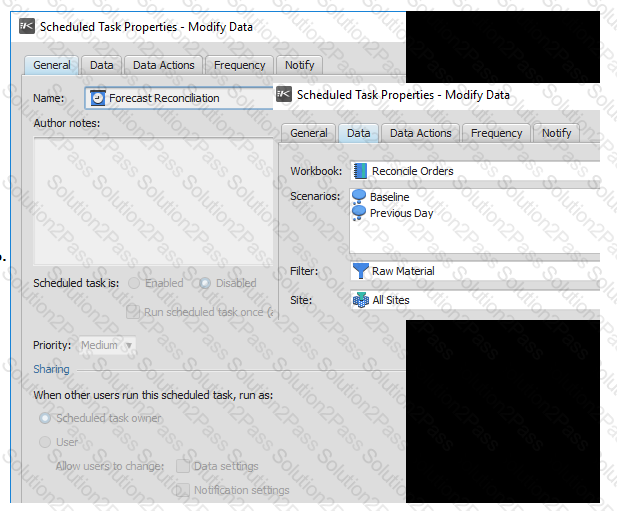
You shared your scheduled task, shown in the graphic, with a set of users who do not have access to all the resources used in the task.
In this situation, which statement is true?
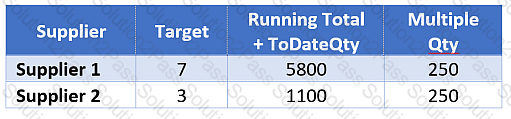
Your suppliers need to receive a report listing their outstanding purchase orders. Each supplier should receive the report in the same format but it should only display the purchase orders associated with their supplier ID.
Based on this situation, which two actions will be required to support this requirement? (Choose two.)
Choose 2 answers
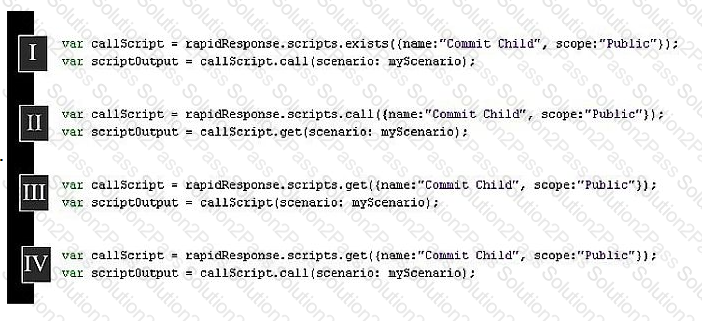
You are creating a new script that must insert a new customer record, archive that record weekly in a new scenario, and then commit the child scenario to a parent scenario. You already have a script that commits child scenarios.
Referring to the graphic, which code will call the script that commits child scenarios in your new script?
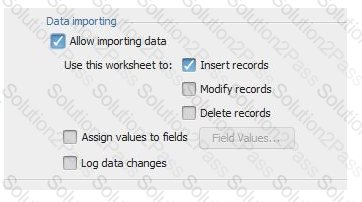
Given the worksheet properties shown in the exhibit, which console output would exist for the following script?
var dataForInsert = [['1','BBy-LCD37','DC-Europe','DCRequest','LCD-3735','DC-Europe','06-01-20',147]];
var wbOrderChng = rapidResponse.workbooks.get({name:'Change Orders',scope:'Private'}, {scenarios: [scenario], filter: {name: 'All Parts', scope: 'Public'}, siteGroup: {name: site, scope: 'Public'}});
var wsOrderChng = wbOrderChng.worksheets.get('ChangeOrders');
var importResult = wsOrderChng.importData(dataForInsert); rapidResponse.console.writeLine(JSON.stringify(importResult));
You have a new demand for 800 units of a product. SourceRule.AllotmentRule for this part is set to OnGoing.
Referring to the graphic, which planned order results will be created to satisfy this demand?
You need to create a workbook to allow users to manage their demand forecast by product, customer region, and distribution site. You also want to simplify user controls and use hierarchies to allow each user to make several selections in the same hierarchy.
In this situation, which two actions should you take? (Choose two.)
Choose 2 answers
After the most recent planning cycle, a planner asks you why there were no new records in the HistoricalPartKPI table. They expected these records to be written as part of a scheduled automation chain. You must determine if the automation chain has been disabled, but you are not familiar with which automation chain should perform this action. As the first step in identifying the automation chain, you need to search for any of its associated resources.
In this situation, which process would guarantee that you have the correct associated resources of the automation chain?
You are creating a metric worksheet to calculate the number of late orders for a specified time period. The metric worksheet will be based on the IndependentDemand table and it has two columns: DueDate and Count. The expression for Count is 1. The worksheet's filter expression is: DaysLate > 0 and Order.Type = 'Actual'.
In this situation, what is the column sequence and grouping properties for the metric worksheet?
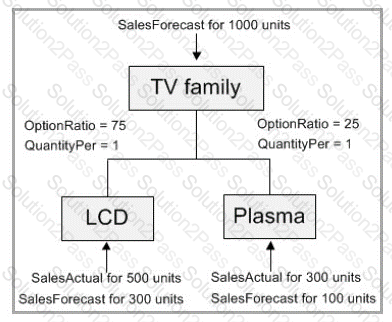
Referring to the graphic, the TV Family represents an MPSConfig planning BOM. No supply is available.
What will be the quantity of the planned order created for the TV family?
You have a worksheet based on the IndependentDemand table that includes columns for key fields plus multi-scenario columns for Quantity and EffectiveDemand. You want to highlight the Quantity fields where the value in the comparison scenario is different from the corresponding value in the workbook's baseline scenario. You want your worksheet to be able to highlight differences in several scenarios.
How would you achieve this highlighting?
You want to track the date of the most recent order placed by each Customer. You also want to make the most efficient use of memory, and query and algorithm performance.
Considering Kinaxis best practices, which data model design would you use?
