QSBA2021 Qlik Sense Business Analyst Certification Exam - February 2021 Release Free Practice Exam Questions (2026 Updated)
Prepare effectively for your Qlik QSBA2021 Qlik Sense Business Analyst Certification Exam - February 2021 Release certification with our extensive collection of free, high-quality practice questions. Each question is designed to mirror the actual exam format and objectives, complete with comprehensive answers and detailed explanations. Our materials are regularly updated for 2026, ensuring you have the most current resources to build confidence and succeed on your first attempt.
A business analyst is developing an app that contains a data model with fields Country. City. Sales ProductName and ProductCategory.The global sales manager wants to add new visualizations to this app
The business analyst must include the following
• Ability to dynamically change the number of countries and cities
• Display a maximum of 10 countries
• Display a maximum of 5 cities per country
Which steps should the business analyst take?
A finance manager uses an Excel file to record travel expenses The file has historical data and is used m multiple Qlik Sense apps The finance manager needs to deploy only the past three months of data to the regional sales managers
Which solution should be used to meet the requirements using the data manager?
A company CFO has requested an app that contains visualizations applicable to analyzing the finance data Each regional finance team will analyze their data, and the app must contain a high-level sheet that navigates to relevant detail sheets.
Which features support a logical design structure?
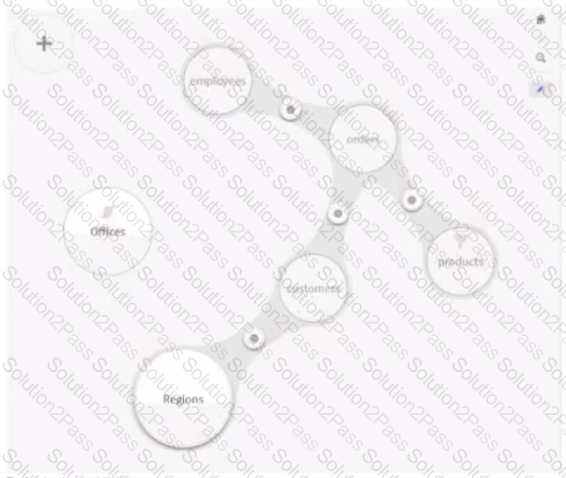
Refer of the exhibit.
A business analyst needs to add a table and make sure it is associated appropriately. The table contains regional information about employee offices and must be able to titer the orders by employee office.
Which steps should the business analyst take?
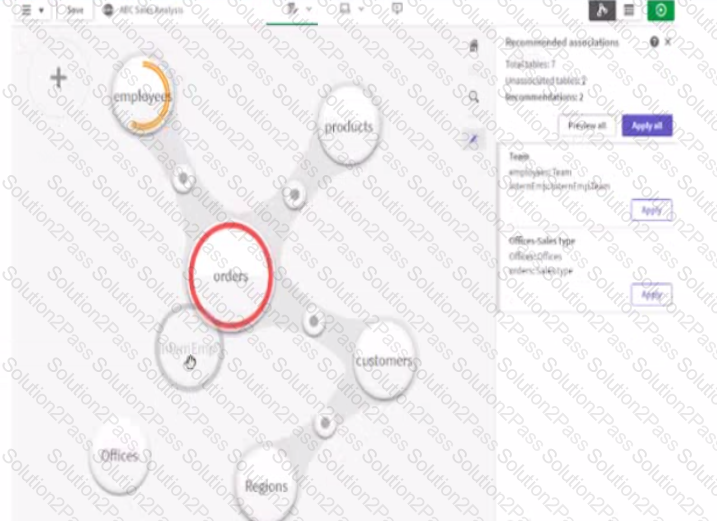
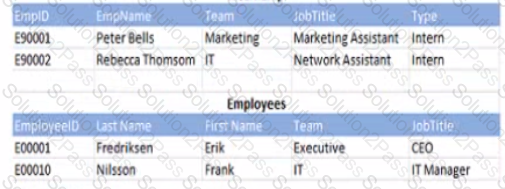
Refer to the exhibit.
A business analyst must add a list of interns to the current sates app. The app contains an existing employees table When the business analyst profiles the data the association vow displays possible associations as shown.
Which action should the business analyst take to meet the requirements?
A business analyst needs to create a master item from an object m an app After right-clicking the object the analyst notices the Add to master Items option is NOT available.What should the business analyst do to fixthis issue?
Refer to the exhibit.
A business analyst needs to display a bat chart only when less than 100 customers are selected
What should the business analyst create to meet this requirement
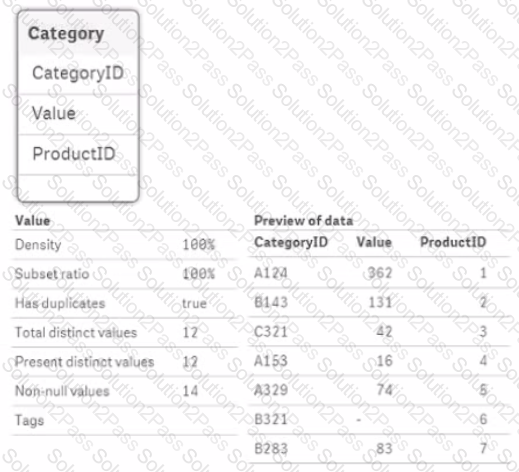
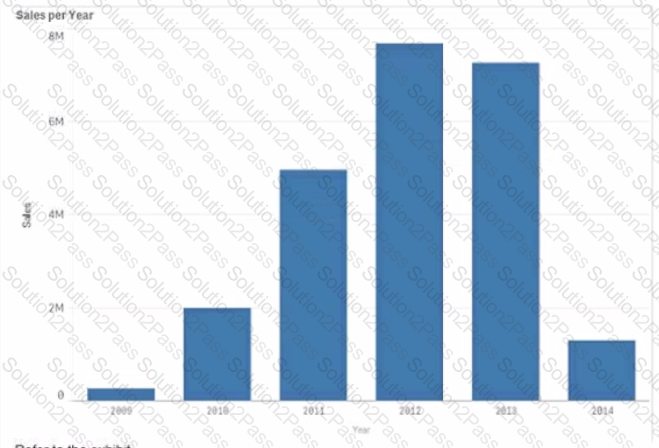
Refer to the exhibits
After the latest data reload a business analyst notices the value tor CategoryID 'B321' seems different What is causing this discrepancy?
A marketing team is using an app to analyze the company events. The team registers attendees with information such as an ID name and region and discusses business opportunities with attendees Opportunities are evaluated m time and set to a different status.
The team wants to use insight Advisor to query events and opportunities to:
• Review specific areas and periods
• Use marketing terms not currently present in the app when classifying opportunities
• Define calendar periods and add calculations for specific data fields
Some examples are as follows:
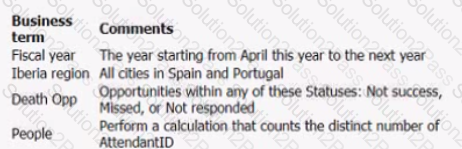
Which process should the business analyst follow?
A Help Desk department sets a first-time fix target of 65% for ail customer calls. The department has a measure that captures the actual first-time fix percentage. A business analyst needs to choose the visualization that most effectively shows the performance against the target using a color gradient Which visualization should the business analyst use?
A company CEO requests a dashboard that easily displays provides understating and tracks company performance. There are several ma n dashboard requirements:
• Viewable by a mobile device
• Display multiple key measures
• Provide ability to easily navigate to other sheets
Which feature meets these requirements?
A business analyst is creating an app for technicians. The app must meet several requirements
• Visualization labels must change according to the selected tame period
• A button to toggle between Month and Year to Date (YTD)
• Two fields combine to create one dimension that is used m several visualizations
Which three options are needed to meet the requirements? (Select three.)
Refer to the exhibit.
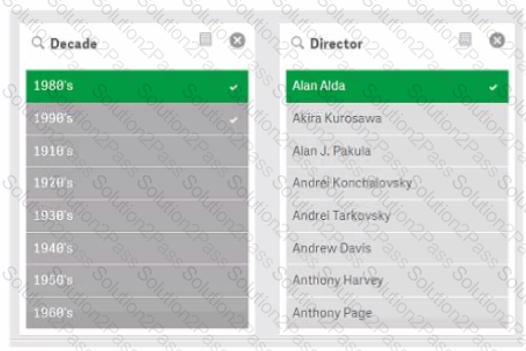
What is the selection slate of light gray values?
A company CEO requests an app that contains global sales information. The CEO needs to present this information to an audience of international investors during an upcoming meeting
The presentation must meet several requirements
• Contain visualizations that present dearly to a large audience
• Answer audience questions dynamically
• Be made available as shared content
• Emphasize important sales revenue
Which Qlik Sense features must the business analyst prepare?
A business analyst s developing an app 10 track the influence of the company's mascot cat on instagram The marketing department has several requirements for this solution.
• Information must be updated every hour to the company's information monitor
• Data from Instagram must be fetched over a REST connection and combined with Google Analytics data
• There must be a way to visualize changes of followers *i a map
Which two features are needed to meet these requirements? (Select two.)
