QSBA2024 Qlik Sense Business Analyst Certification Exam-2024 Free Practice Exam Questions (2026 Updated)
Prepare effectively for your Qlik QSBA2024 Qlik Sense Business Analyst Certification Exam-2024 certification with our extensive collection of free, high-quality practice questions. Each question is designed to mirror the actual exam format and objectives, complete with comprehensive answers and detailed explanations. Our materials are regularly updated for 2026, ensuring you have the most current resources to build confidence and succeed on your first attempt.
A business analyst needs to rapidly prototype an application design for a prospective customer. The only dataset provided by the customer contains 30 fields, but has over one billion rows. It will take too long to keep loading in its entirety while the analyst develops the data model.
Which action should the business analyst complete in the Data manager?
Exhibit.
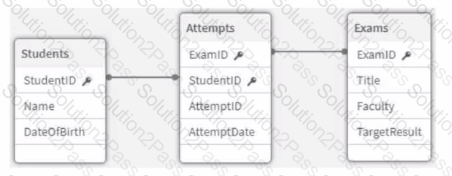
Refer to the exhibit.
An app is being developed at a university to monitor student exam attempts- Three core tables are loaded into the app for Students, Exams, and Attempts. Students can attempt the same exam multiple times.
Before building any visualizations, the business analyst needs to know:
• How many students are in the system
• What percentage of students have not yet attempted an exam
Which metadata should the analyst focus on to answer these questions?
A business analyst needs to build a chart that enables users to analyze the correlation between the following measures for all products:
• Product Sales ($)
• Order Volume
• Margin%
Which visualization should the business analyst use?
A business analyst needs to create a visualization that compares two measures over time using a continuous scale that includes a range. The measures will be Profit and Revenue.
Which visualization should the business analyst use?
A company director who spends very little time in applications needs to be informed when a threshold is breached. Which feature should the business analyst use?
A business analyst is creating a data model from several Excel files that contain several hundred thousand rows of data. The requirements include:
• Users need to drill down to various details within the available data set.
• Several final measures will be repeatedly used. These final measures require combining several fields in a single table.
• User experience and load time is a high priority.
Which action should the business analyst take to meet these requirements?
The business analyst creates one table by concatenating and joining several source tables. This has resulted in a table of several thousand rows that may have several columns containing between 30% and 70% null values. The business analyst needs to understand the level of null values in each field of this table to determine if this is an issue.
Which capability should the business analyst use?
A company CEO requests an app that contains global sales information. The CEO needs to present this information to an audience of international investors during an upcoming meeting.
The presentation must meet several requirements:
• Contain visualizations that present clearly to a large audience
• Answer audience questions dynamically
• Be made available as shared content
• Emphasize important sales revenue
Which Qlik Sense features should the business analyst prepare?
A business analyst created a visualization that has a color indicator when an order is below a certain fixed profit threshold. This visualization now needs to change so that the threshold can be defined by the user. The user base is approximately 1000 heavy Excel users. These thresholds will be defined by each user somewhat frequently, although the data changes only once per day.
Which action should the business analyst take to update this visualization?
A dashboard developer finishes creating a supply chain analysis app and is presenting it to leadership for review. The landing page shows four visualizations including:
• Bar chart showing available supply by product category
• Line chart showing total cost of deliveries to the warehouse by month-year
• Scatter plot showing cost of delivery and time-to-deliver by product
• A map that shows the volume of delivery from suppliers to warehouses using a line layer
Leadership asks the developer how they can see the total cost of delivery overall. How can the analyst show this information to leadership?
A business analyst using a shared folder mapped to S:\488957004\ receives an Excel file with more than 100 columns. Many of the columns are duplicates. Any current columns that should be used have the suffix '_c' appended to the column name.
Which action should the business analyst take to load the Excel data?
A banking organization needs a dashboard that shows the following:
• A KPI indicator for current year (CY) versus last year (LY) revenue
• A scatter plot that shows the cost versus revenue of product categories
• A treemap that shows average customer satisfaction rating based on regions
• A table that shows CY cost by record number, financial instrument, and bank
In addition to the customer satisfaction rating, which fields should be used to create the required measures?
A business analyst is developing an app that requires a complex visualization. The visualization is very similar in style and configuration to another visualization in a different app, but the data models are completely different.
Which action should the business analyst take to most efficiently create the new visualization?
A business analyst is working with retail data for consumer products. The customer is interested in the following:
• Ability to look for outliers on sales volume and margin %
• Ability to understand the clustering of products visually
• Ability to see products that are above the median sales volume
Which action should the business analyst take to implement these requirements?
A business analyst is developing an app that contains a data model with fields: Country, City, Sales, ProductName, and ProductCategory. The global sales manager wants to add new visualizations to this app.
The business analyst must include the following:
• Ability to dynamically change the number of countries and cities
• Display a maximum of 10 countries
• Display a maximum of 5 cities per country
Which steps should the business analyst take?
