QV12BA QlikView 12 Business Analyst Certification Exam Free Practice Exam Questions (2026 Updated)
Prepare effectively for your Qlik QV12BA QlikView 12 Business Analyst Certification Exam certification with our extensive collection of free, high-quality practice questions. Each question is designed to mirror the actual exam format and objectives, complete with comprehensive answers and detailed explanations. Our materials are regularly updated for 2026, ensuring you have the most current resources to build confidence and succeed on your first attempt.
A business analyst wants to display several dimensions and key performance indicators (KPI) in one object Aggregations must be done in this object. The user must be able to change the sorting of the dimensions and KPIs quickly and easily.
Which object meets these requirements?
A business analyst uses a QlikView application developed on a desktop with a screen resolution of 1280 x 800 During weekly meetings the analyst presents the application using a projector with a maximum screen resolution of 1280 x 720 At this resolution, vertical scroll bars are displayed
Which setting can solve the problem?
For a gauge, in which two places in the chart properties can expressions be entered? (Select two )
Refer to the exhibit.
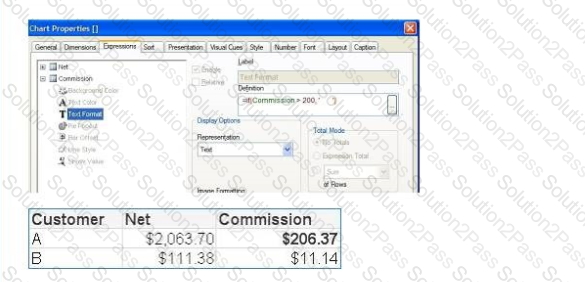
A business analyst creates a straight table to display net sales and commissions. The table uses the Anal font by default. The analyst will use a Text Format Expression to show commissions greater than $200 in Arial Bold font.
Which is the correct expression?
A business analyst will compare sales growth between this year and last year by country. The analyst is given the sales values and must calculate the growth.
Which two charts can be used? (Select two.)
A business analyst creates a document with sales data for different regions, products, and salespeople. The analyst needs to create an object that will show the percentage of the total sales when one or more values are selected.
Which two objects can the analyst use to meet these requirements? (Select two.)
An Invoices table has a DaysOverdue field A chart is required to analyze overdue invoices in 30 day intervals Which function should a business analyst use to meet this requirement?
Refer to the exhibits.
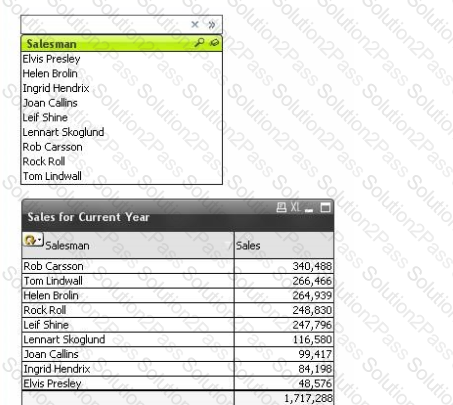
A business analyst has an application showing sales performance. The analyst will enter an expression in the search box of a filter pane to show only Salesman who generate more than $200,000 in sales.
Which is the correct expression?
What are two ways to calculate the Sales for the ProductCategory. Shoes? {Select two )
A business analyst needs to calculate the average order value by country. Which two objects meet this requirement? (Select two.)
Refer to the exhibit.
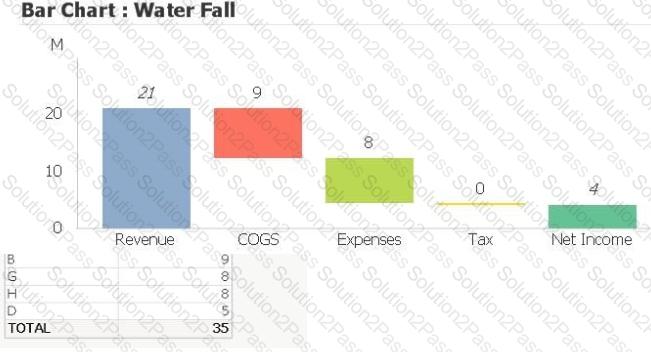
A business analyst creates a water fall chart to understand how an initial value is affected by a series of intermediate positive and negative values.
Which two actions must a business analyst perform to create the water fall chart shown? (Select two )
Refer to the exhibit.
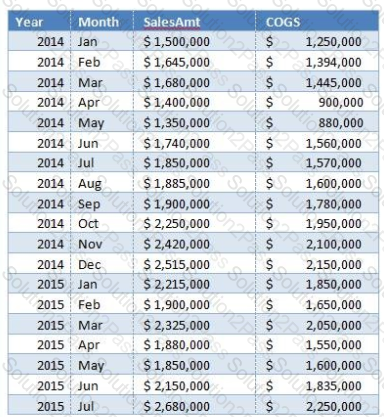
The dataset shown has been loaded into a QhkView application The user has selected the year 7015' to analyze
This expression is used to calculate a value:
Num((Sum({!<[Month] = {'May'} >> SalesAmt-COGS)/Sum({1<[Month] = {'May*} >} SalesAmt)), ■#,##0.0**)
What is the result?
What is the result?
A business analyst has data for these fields
• Year
• Sales Amount
• Product Number
• Country
• Order Number
How many dimensions and measures exist?
A data model contains 1 billion records and a straight table renders all of the data at the most granular level. The business users do NOT need all of the detailed information. The business analyst needs to improve the rendering time of the straight table.
Which two approaches should the analyst use? (Select two )
A business analyst designs a sheet with a list of customers. The analyst wants to add a small image to show the company logo for each customer.
Which three objects meet this requirement? (Select three )
