Analytics-Con-301 Salesforce Certified Tableau Consultant Free Practice Exam Questions (2026 Updated)
Prepare effectively for your Salesforce Analytics-Con-301 Salesforce Certified Tableau Consultant certification with our extensive collection of free, high-quality practice questions. Each question is designed to mirror the actual exam format and objectives, complete with comprehensive answers and detailed explanations. Our materials are regularly updated for 2026, ensuring you have the most current resources to build confidence and succeed on your first attempt.
From the desktop, open the CC workbook.
Open the Manufacturers worksheet.
The Manufacturers worksheet is used to
analyze the quantity of items contributed by
each manufacturer.
You need to modify the Percent
Contribution calculated field to use a Level
of Detail (LOD) expression that calculates
the percentage contribution of each
manufacturer to the total quantity.
Enter the percentage for Newell to the
nearest hundredth of a percent into the
Newell % Contribution parameter.
From the File menu in Tableau Desktop, click
Save.
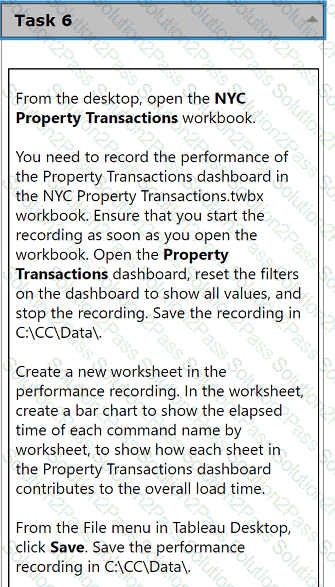
From the desktop, open the NYC
Property Transactions workbook.
You need to record the performance of
the Property Transactions dashboard in
the NYC Property Transactions.twbx
workbook. Ensure that you start the
recording as soon as you open the
workbook. Open the Property
Transactions dashboard, reset the filters
on the dashboard to show all values, and
stop the recording. Save the recording in
C:\CC\Data\.
Create a new worksheet in the
performance recording. In the worksheet,
create a bar chart to show the elapsed
time of each command name by
worksheet, to show how each sheet in
the Property Transactions dashboard
contributes to the overall load time.
From the File menu in Tableau Desktop,
click Save. Save the performance
recording in C:\CC\Data\.
Use the following login credentials to sign in
to the virtual machine:
Username: Admin
Password:
The following information is for technical
support purposes only:
Lab Instance: 40201223
To access Tableau Help, you can open the
Help.pdf file on the desktop.
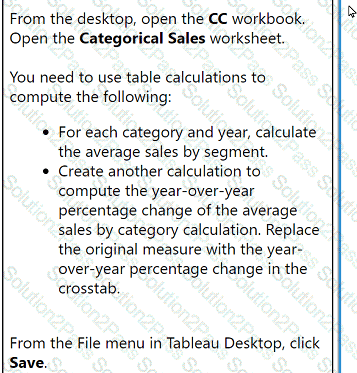
From the desktop, open the CC workbook.
Open the Categorical Sales worksheet.
You need to use table calculations to
compute the following:
. For each category and year, calculate
the average sales by segment.
. Create another calculation to
compute the year-over-year
percentage change of the average
sales by category calculation. Replace
the original measure with the year-
over-year percentage change in the
crosstab.
From the File menu in Tableau Desktop, click
Save.
From the desktop, open the CC workbook.
Open the Incremental worksheet.
You need to add a line to the chart that
shows the cumulative percentage of sales
contributed by each product to the
incremental sales.
From the File menu in Tableau Desktop, click
Save.
From the desktop, open the CC workbook.
Open the City Pareto worksheet.
You need to complete the Pareto chart to show the percentage of sales compared to the percentage of cities. The chart must show references lines to visualize how the data compares to the Pareto principle.
From the File menu in Tableau Desktop, click Save.
From the desktop, open the CC workbook. Use the US Population Estimates data source.
You need to shape the data in US Population Estimates by using Tableau Desktop. The data must be formatted as shown in the following table.
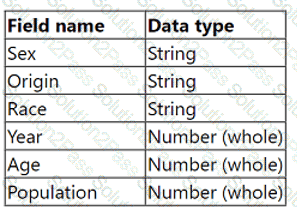
Open the Population worksheet. Enter the total number of records contained in the data set into the Total Records parameter.
From the File menu in Tableau Desktop, click Save.
A client has a large data set that contains more than 10 million rows.
A consultant wants to calculate a profitability threshold as efficiently as possible. The calculation must classify the profits by using the following specifications:
. Classify profit margins above 50% as Highly Profitable.
. Classify profit margins between 0% and 50% as Profitable.
. Classify profit margins below 0% as Unprofitable.
Which calculation meets these requirements?
A client wants to provide sales users with the ability to perform the following tasks:
· Access published visualizations and published data sources outside the company network.
· Edit existing visualizations.
· Create new visualizations based on published data sources.
. Minimize licensing costs.
Which site role should the client assign to the sales users?
A client collects information about a web browser customers use to access their website. They then visualize the breakdown of web traffic by browser version.
The data is stored in the format shown below in the related table, with a NULL BrowserID stored in the Site Visitor Table if an unknown browser version
accesses their website.
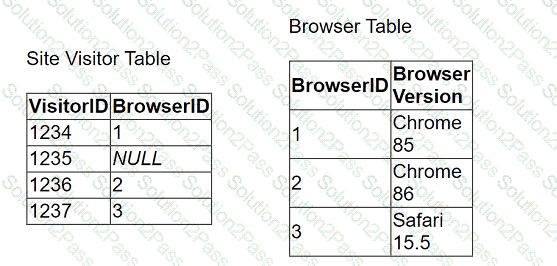
The client uses "Some Records Match" for the Referential Integrity setting because a match is not guaranteed. The client wants to improve the performance of
the dashboard while also getting an accurate count of site visitors.
Which modifications to the data tables and join should the consultant recommend?
A client notices that while creating calculated fields, occasionally the new fields are created as strings, integers, or Booleans. The client asks a consultant if
there is a performance difference among these three data types.
What should the consultant tell the customer?
An executive-level workbook leverages 37 of the 103 fields included in a data source. Performance for the workbook is noticeably slower than other workbooks
on the same Tableau Server.
What should the consultant do to improve performance of this workbook while following best practice?
For a new report, a consultant needs to build a data model with three different tables, including two that contain hierarchies of locations and products. The third
table contains detailed warehousing data from all locations across six countries. The consultant uses Tableau Cloud and the size of the third table excludes
using an extract.
What is the most performant approach to model the data for a live connection?
A client is considering migrating from Tableau Server to Tableau Cloud.
Which two elements are determining factors of whether the client should use Tableau Server or Tableau Cloud? Choose two.
A consultant builds a report where profit margin is calculated as SUM([Profit]) / SUM([Sales]). Three groups of users are organized on Tableau Server with the
following levels of data access that they can be granted.
. Group 1: Viewers who cannot see any information on profitability
. Group 2: Viewers who can see profit and profit margin
. Group 3: Viewers who can see profit margin but not the value of profit
Which approach should the consultant use to provide the required level of access?
A client has a published data source in Tableau Server and they want to revert to the previous version of the data source. The solution must minimize the impact
on users.
What should the consultant do to accomplish this task?
A consultant wants to improve the performance of reports by moving calculations to the data layer and materializing them in the extract.
Which calculation should the consultant use?
A client wants to grant a user access to a data source hosted on Tableau Server so that the user can create new content in Tableau Desktop. However, the user should be restricted to seeing only a subset of approved data.
How should the client set up the filter before publishing the hyper file so that the Desktop user follows the same row-level security (RLS) as viewers of the end content?
A consultant wants to improve the performance of reports by moving calculations to the data layer and materializing them in the extract.
Which type of calculation is the consultant able to move?
A client has several long-term shipping contracts with different vendors that set rates based on shipping volume and speed. The client requests a dashboard
that allows them to model shipping costs for the next week based on the selected shipping vendor. Speed for the end user is critical.
Which dashboard building strategy will deliver the desired result?
A consultant used Tableau Data Catalog to determine which workbooks will be affected by a field change.
Catalog shows:
Published Data Source → 7 connected workbooks
Field search (Lineage tab) → 6 impacted workbooks
The client asks: Why 7 connected, but only 6 impacted?
