CLSSBB GAQM Certified Lean Six Sigma Black Belt (CLSSBB) Free Practice Exam Questions (2026 Updated)
Prepare effectively for your GAQM CLSSBB Certified Lean Six Sigma Black Belt (CLSSBB) certification with our extensive collection of free, high-quality practice questions. Each question is designed to mirror the actual exam format and objectives, complete with comprehensive answers and detailed explanations. Our materials are regularly updated for 2026, ensuring you have the most current resources to build confidence and succeed on your first attempt.
A process shows the following number of defects. Each sample size for this process is
85. 3 8 2 7 7 6 8 8 9 5.
What control chart should be used?
Calculate the interaction effect:
Typically, which of the following activities is done earliest in the formation of a project team?
One of the most popular measures of variability in a data set or population is ______________.
Which of the following is a commonly accepted level for alpha risk?
Find Cpk
A control chart will be used to monitor the number of scratches on a product. The following data have been collected:

The appropriate control chart to use is:
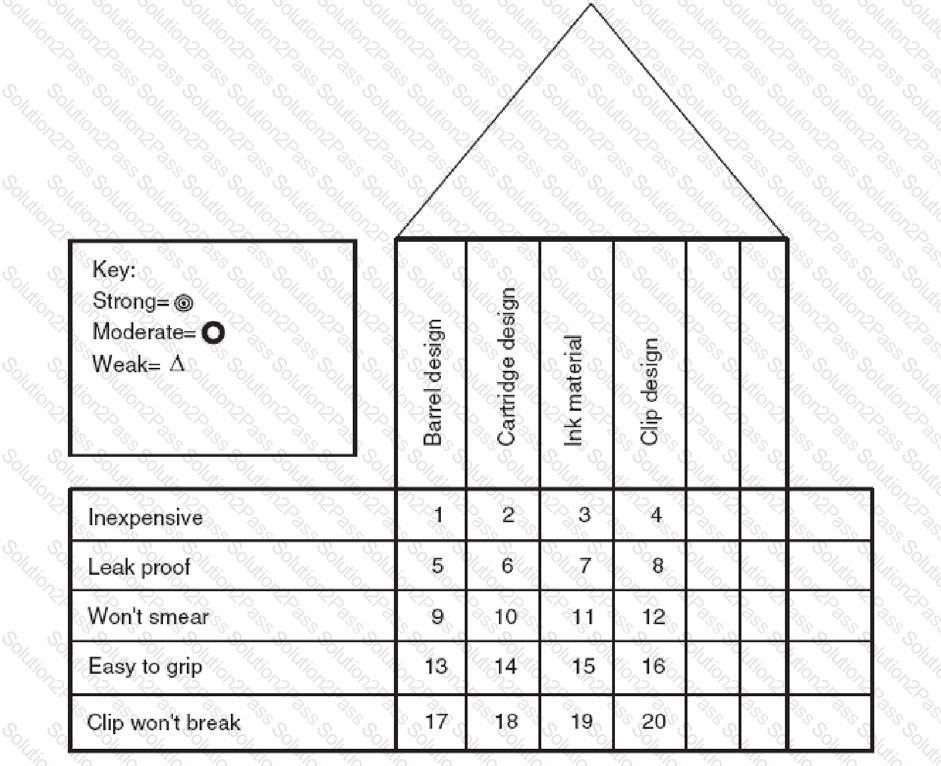
This QFD matrix was used in the design process for a ball point pen. What symbol is appropriate for the square labeled 10?

Which of the following is the best way to enhance the long-term availability of a machine?
If the value of the test statistic had been 0.185, what action should have been taken regarding the null hypothesis?
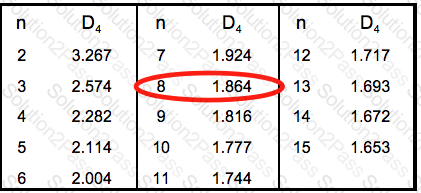
A set of data from a process has 8 readings per sample and 50 samples. The mean of the 50 sample means is 12.62. The mean of the 50 ranges is 0.18.Find control limits for the R chart.
Which of the following techniques would help increase process stability when the cause of variation is a cluttered work station?
Which of the following methods is used to develop an exhaustive list of ideas about a subject?
A principle disadvantage of fractional factorial experimental designs is:
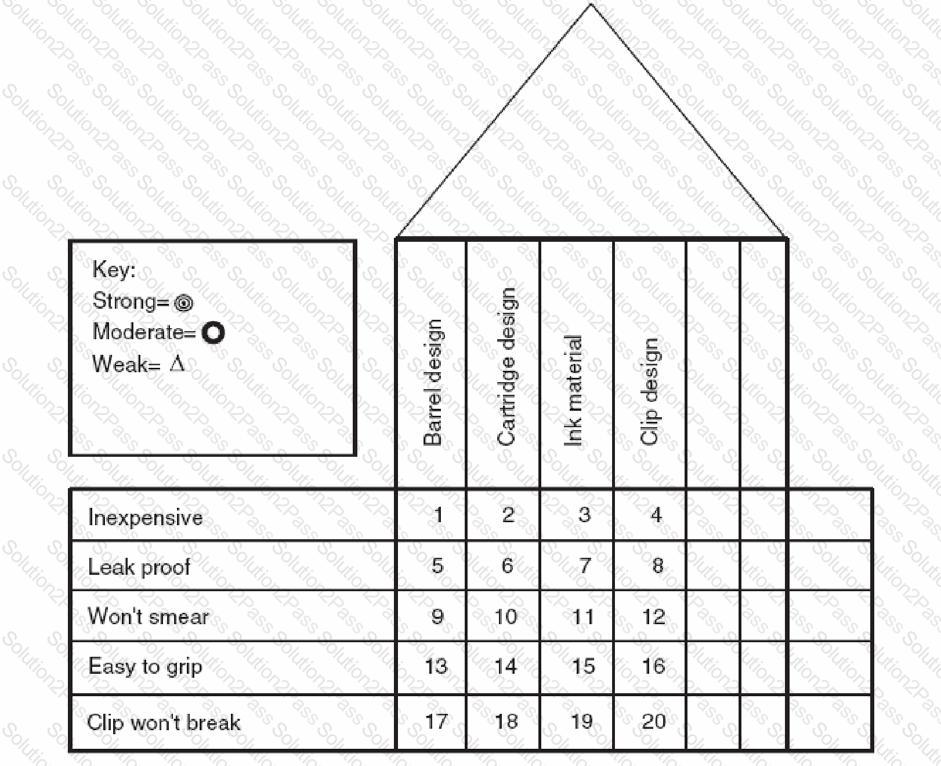
This QFD matrix was used in the design process for a ball point pen. What symbol is appropriate for the square labeled 9?

A company’s accounts payable department is trying to reduce the time between receipt and payment of invoices. If the team has just completed a flowchart of the process and identified the critical steps, which of the following tools should be used next?
A change agent is responsible for helping the organization do which of the following?
If item A is more likely to be detected than item B which will have the highest Occurrence value?
What kind of Graph would help us to analyze stability of non-parametric distribution of data points?
All of the following experimental designs can be used to investigate interactions EXCEPT
 = 1.864 x 0.18 = 0.33
 = 0.1111 x 0.18 = 0.02
