Analytics-DA-201 Salesforce Certified Tableau Data Analyst Free Practice Exam Questions (2026 Updated)
Prepare effectively for your Salesforce Analytics-DA-201 Salesforce Certified Tableau Data Analyst certification with our extensive collection of free, high-quality practice questions. Each question is designed to mirror the actual exam format and objectives, complete with comprehensive answers and detailed explanations. Our materials are regularly updated for 2026, ensuring you have the most current resources to build confidence and succeed on your first attempt.
You have a database that includes field named sales, City and Region.
You have the following chart that shows the number of sales made in different cities.
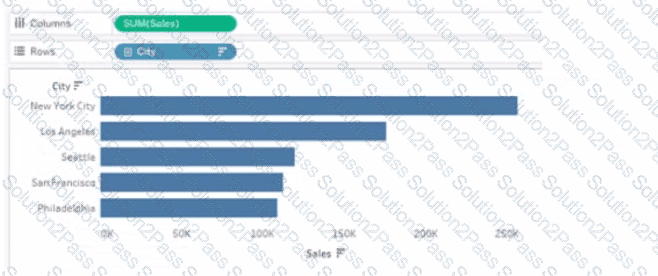
You want to dynamically show the corresponding region when users hover their mouse over any of the bars.
What should you do?
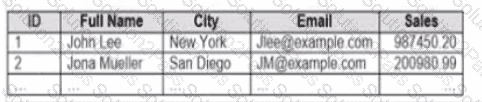
You company has two divisions located in the United States and Germany Bach division has a separate database. The following is a sample of the sales data for the division in the United States.
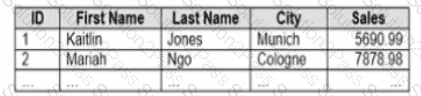
The following is a sample of the sales data for me division in Germany.
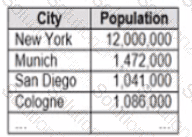
You have population data in a file named Populatio.csv. the following is a sample of the data.
You plan to create a visualization that ml show tie sales per capita for each salesperson Each salesperson must be identified by identified by their full name.
You need to prepare the data to support the planned visualization. The data source must support being published .
Which four actions should you perform in order?
(Place the four correct options n order Use the arrows to move Options to Answer Area arrows to re-order the options.
Use Answer Area arrows to re-order the options)


You have the following table.
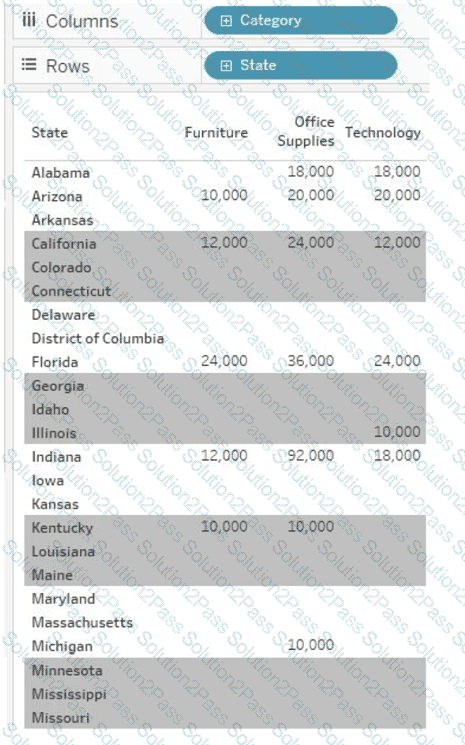
You need each record to alternate between grey and white.
What should you change in the Format Shading pane?
You create a worksheet named Sales by Region and hide the tide of the worksheet. You print the worksheet as a PDF and notice that the worksheet title appears. You need to prevent the title from appearing when you print the worksheet as a PDF. Which settings should configure from the File menu in Tableau Desktop?
You have a table that contains the following data.
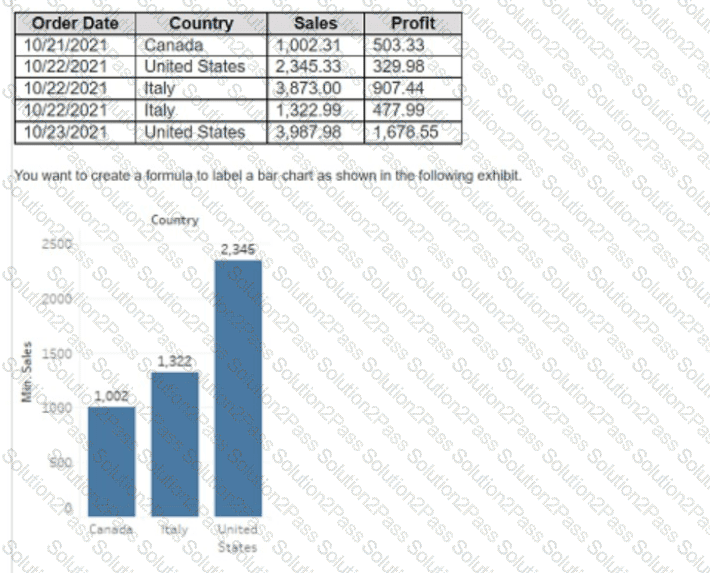
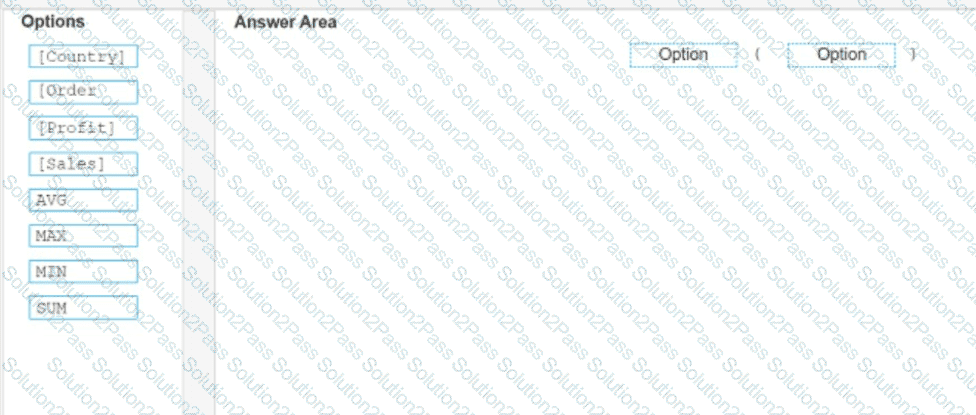
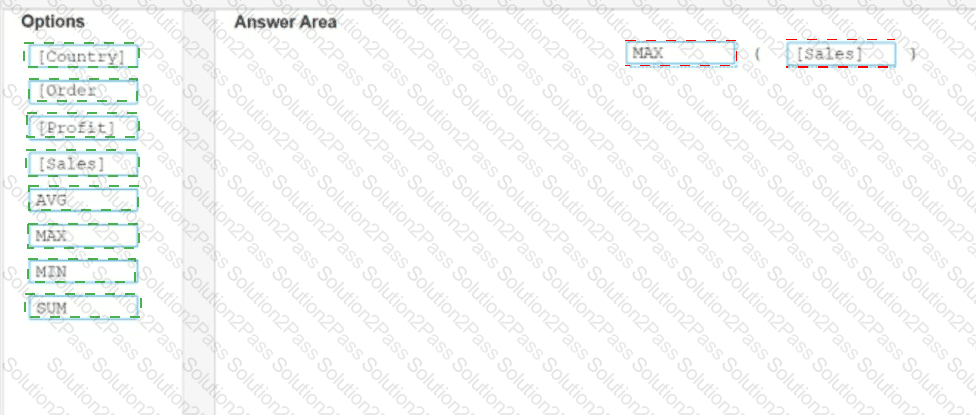
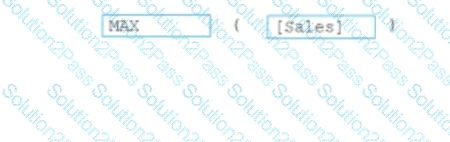
How should you complete the formula? (Drag the appropriate Options to the Answer Area and drop into the correct locations.)
You are the owner of an alert.
You receive an email notification that the alert was suspended
From where can you resume the suspended alert?
In a dataset, a Data Analyst has a string field named Name that contains unnecessary semicolons.
Which function should the analyst use to remove the semicolons from the Name field?
A Data Analyst has the following tiled dashboard that has one sheet called Sheet 3.
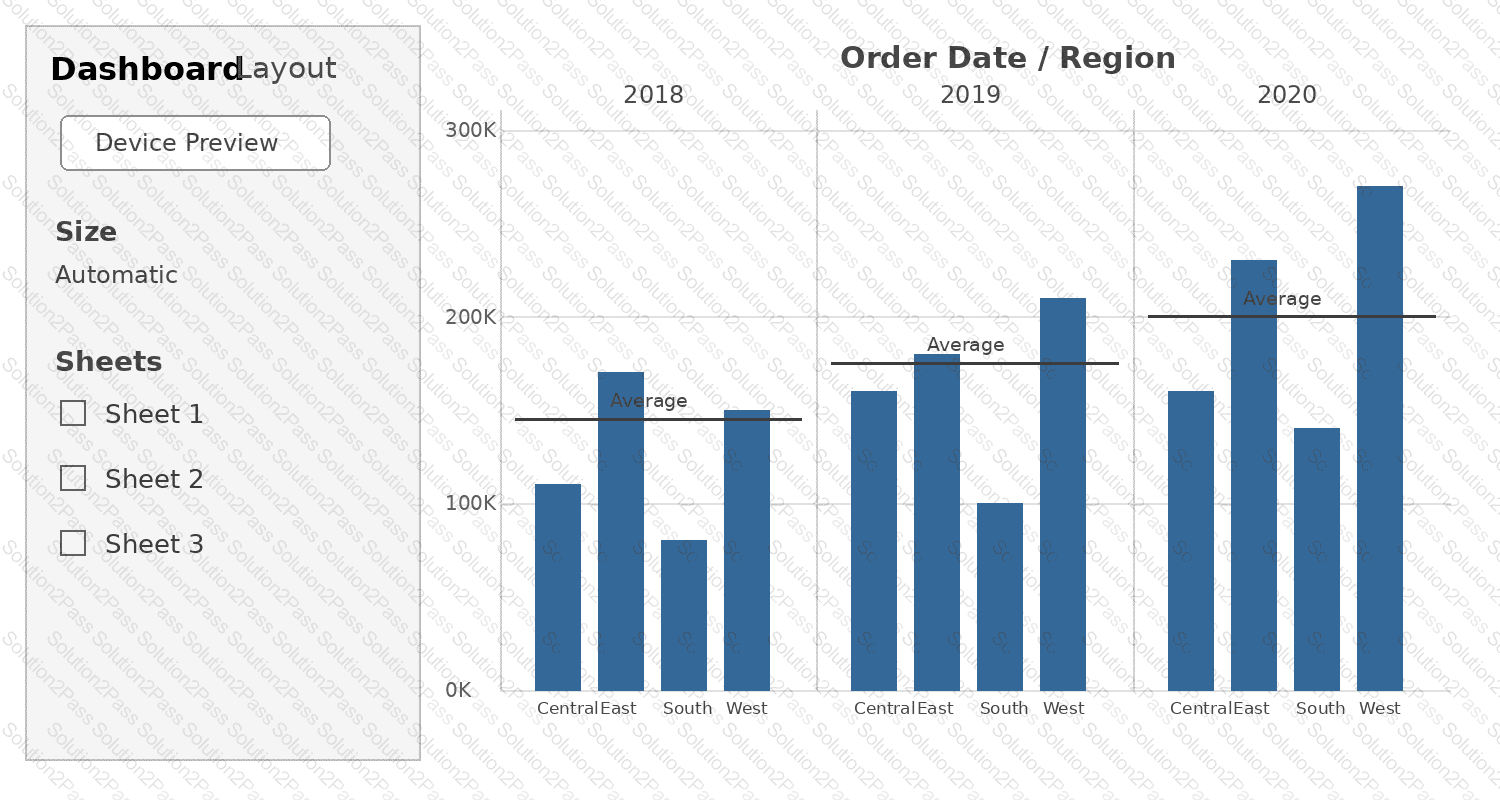
The analyst wants to replace the sheet with Sheet 2.
What should the analyst do?
A Data Analyst has the following dashboard.
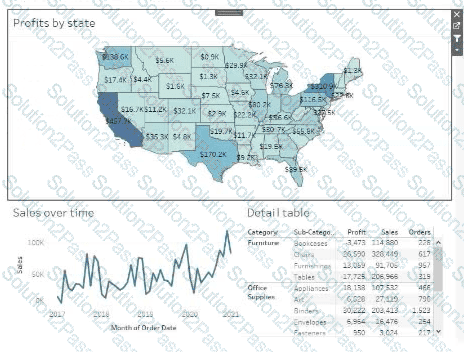
Currently, the map is used as a filter that affects the data on the other sheets of the dashboard.
The analyst needs to configure the dashboard to ensure that selecting a data point on the map only filters the Detail table.
What should the analyst do?
A Data Analyst applied a dimension filter to a worksheet with FIXED Level of Detail (LOD) calculations.
How does this filter affect the worksheet?
A Data Analyst has a data source that contains the following columns:
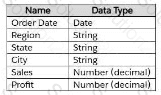
he analyst has the following FIXED Level of Detail (LOD) expression called Region Sales:
{ FIXED [Region] : SUM([Sales] ) }
The analyst has a view that has a dimension filter on the State column to exclude five states.
What should the analyst do to ensure the five states are also excluded from the LOD expression?
A colleague provides a Data Analyst with access to a folder that has the following files:
Sales.csv
Book1.json
Sales.tds
Export.mdb
Which file can contain information for connecting to an external data source, such as an SQL Server database?
A Data Analyst would like to receive the draft results of a colleague ' s Tableau Prep flow to start work on a dashboard before it has been published.
What should the analyst do to accomplish this?
A Data Analyst is using containers on a dashboard.
How should the analyst make sure multiple objects within a container are always taking up the same width or height, even if the container is resized?
You have the Mowing dashboard.
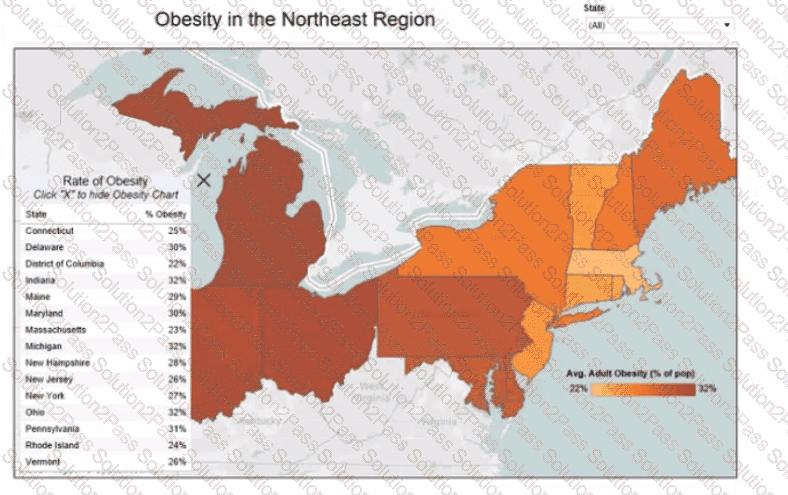
Which two elements are floating? Choose two.
You have the following dataset in Microsoft Excel.
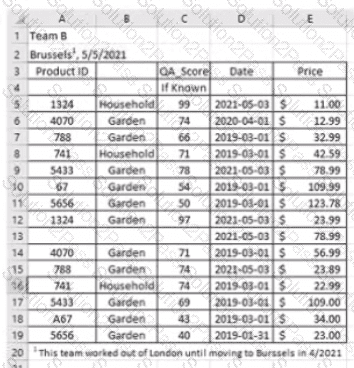
You are using Data interpreter to cleans the dataset. Data interpreter provides the following results.
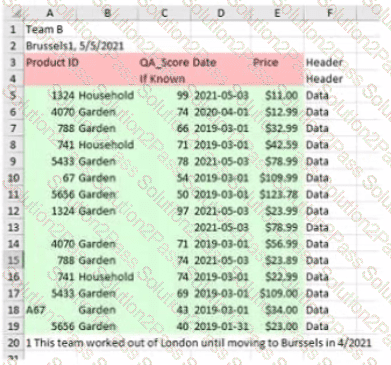
How many rows of data will be ingested into Tableau as values?
You have the following line chart that shows the average sales by month.
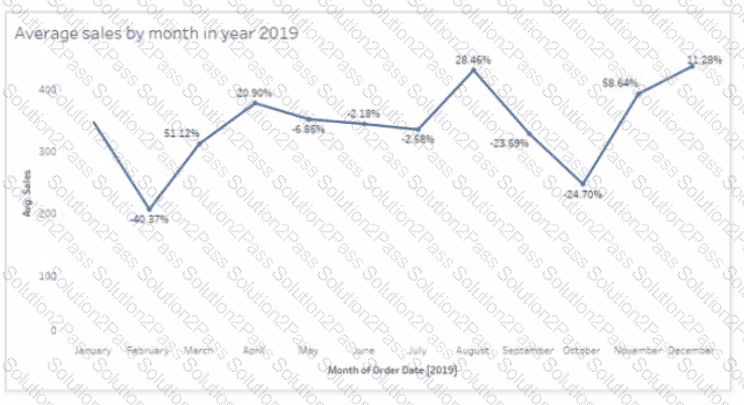
Which month had the biggest increase in swage sales compared to me previous month in 2019?
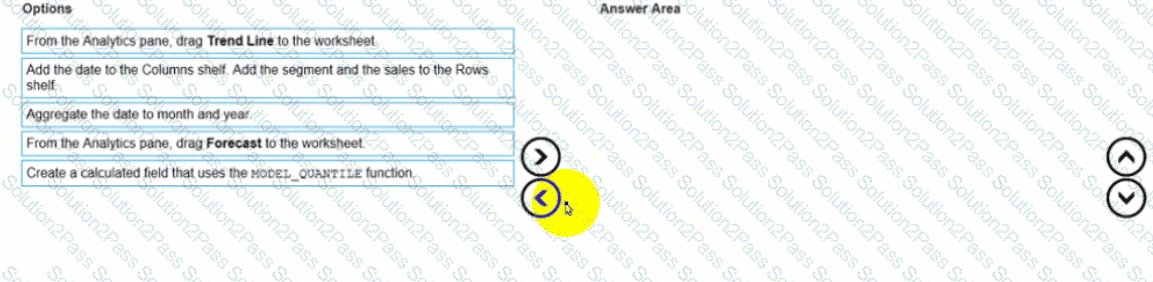
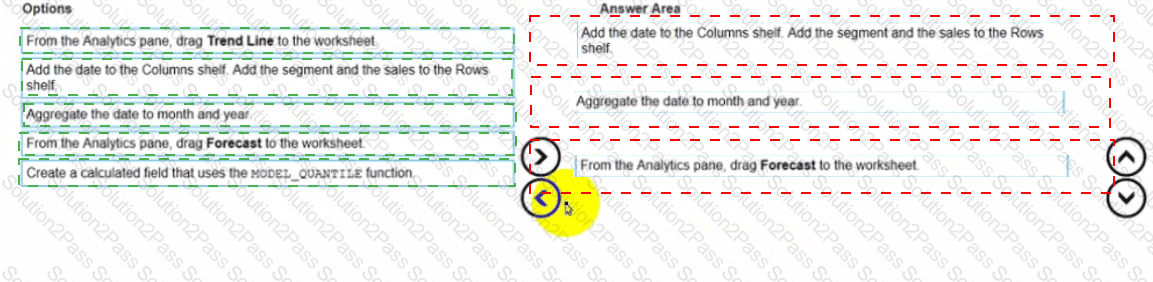
You have a dataset that contains daily sales by business segment from 2017 to the present
You want to use monthly historical trends to predict sales by segment in the future
Which three actions should you perform m order?
(Place the three correct options in order Use the arrows to move Options lo Answer Area I In Answer Area arrows to re order the options.)
How should a Data Analyst implement row-level security to ensure secure access to a published data source for viewers and explorers?
You have the following bar chart.
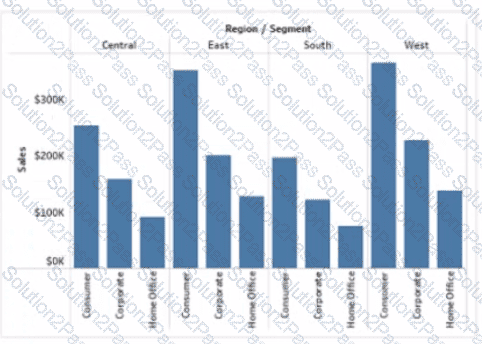
You want the chart to appear as shown in the Mowing exhibit.
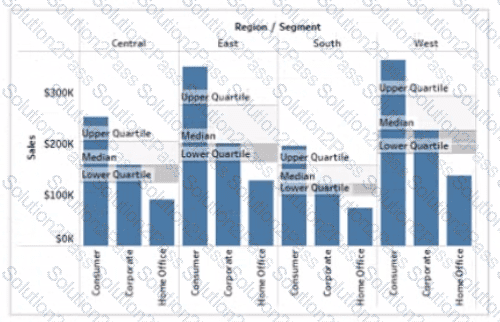
What should you add?