Desktop-Certified-Associate Tableau Desktop Certified Associate Free Practice Exam Questions (2026 Updated)
Prepare effectively for your Tableau Desktop-Certified-Associate Tableau Desktop Certified Associate certification with our extensive collection of free, high-quality practice questions. Each question is designed to mirror the actual exam format and objectives, complete with comprehensive answers and detailed explanations. Our materials are regularly updated for 2026, ensuring you have the most current resources to build confidence and succeed on your first attempt.
Total 108 questions
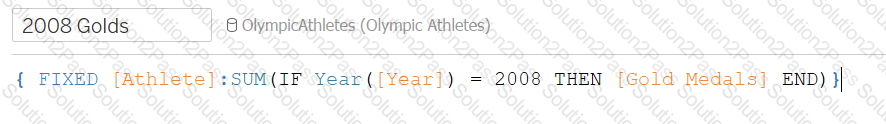
Connect to the Olympic Athletes data source, which athlete won at least one gold in 2008 Olympics and then won at least 4 golds in 2012 Olympics.
 Graphical user interface, text, application, website
Description automatically generated
Graphical user interface, text, application, website
Description automatically generated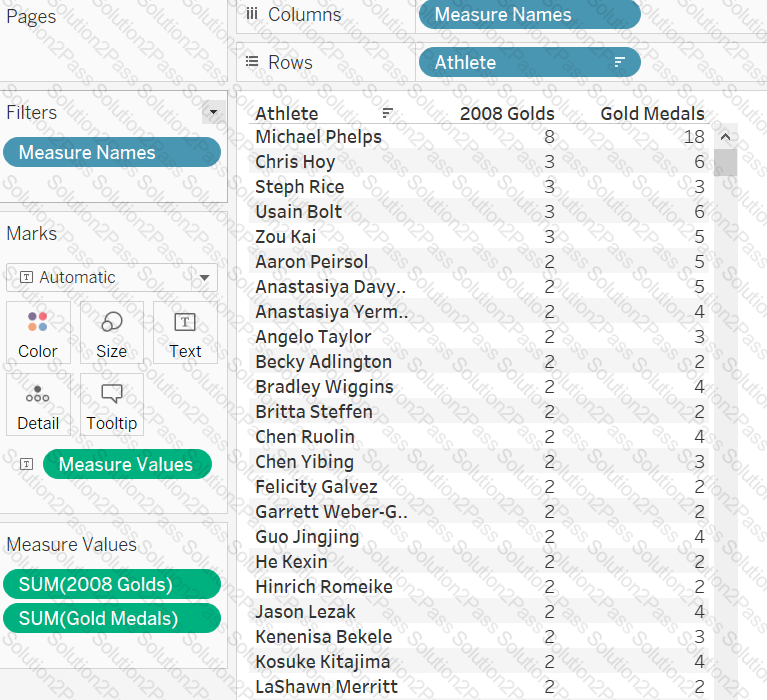 Graphical user interface, text, application
Description automatically generated
Graphical user interface, text, application
Description automatically generated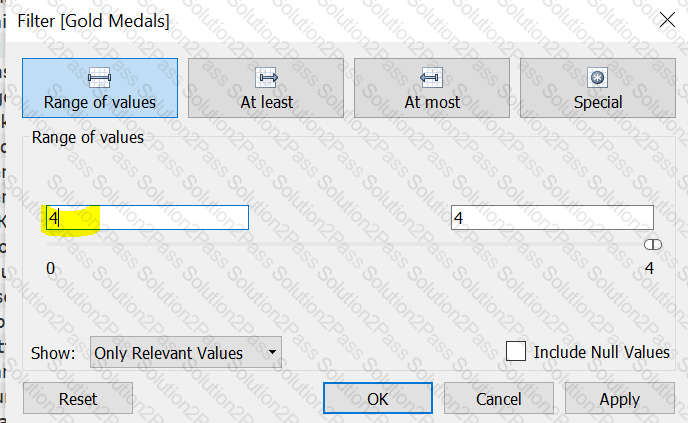 Graphical user interface
Description automatically generated
Graphical user interface
Description automatically generated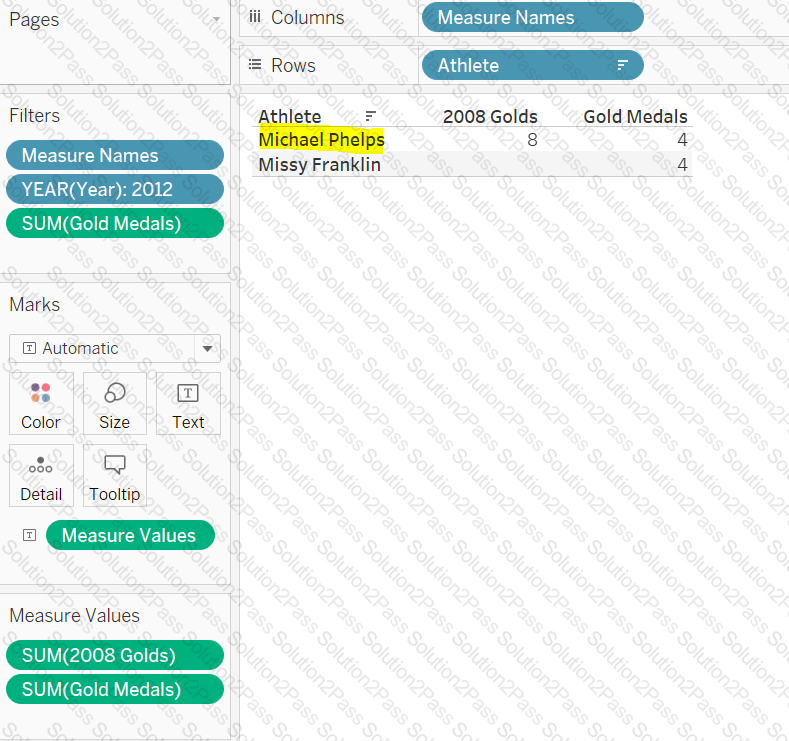 Graphical user interface, text, application, chat or text message
Description automatically generated
Graphical user interface, text, application, chat or text message
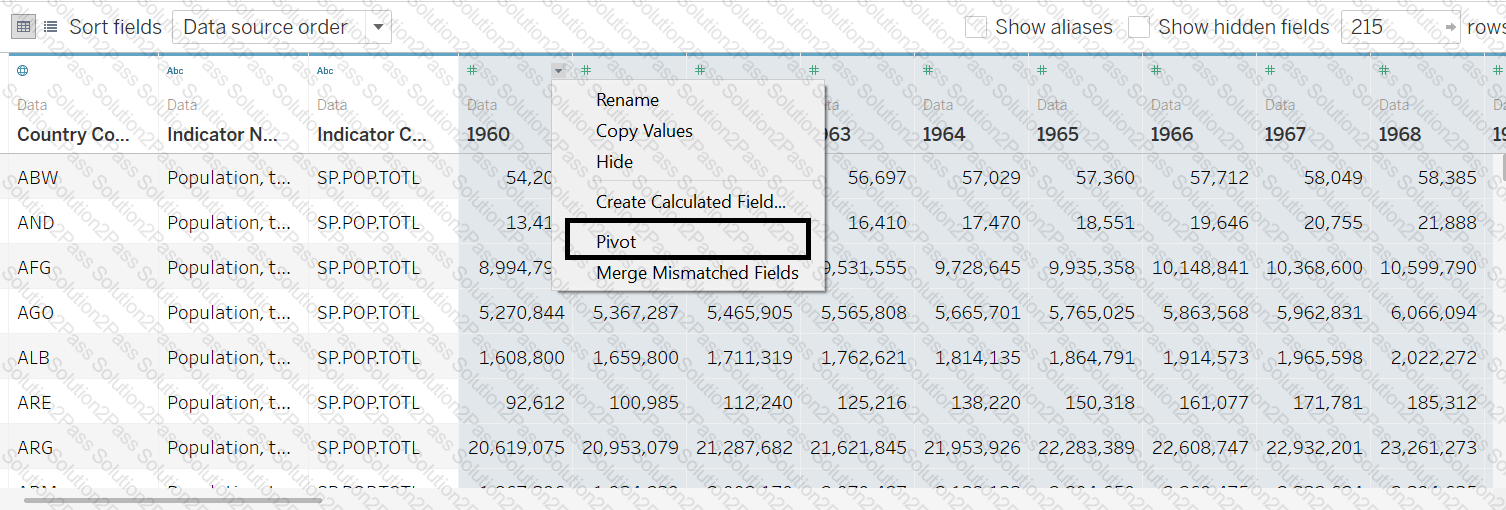
Description automatically generatedBlend the Significant Volcano Eruption dataset with the Country population dataset using year and country. Find out which country is having 4 volcano eruptions in the year 1963 and what was the population of this country in the same year?
 Graphical user interface, application
Description automatically generated
Graphical user interface, application
Description automatically generated Graphical user interface, text, application
Description automatically generated
Graphical user interface, text, application
Description automatically generated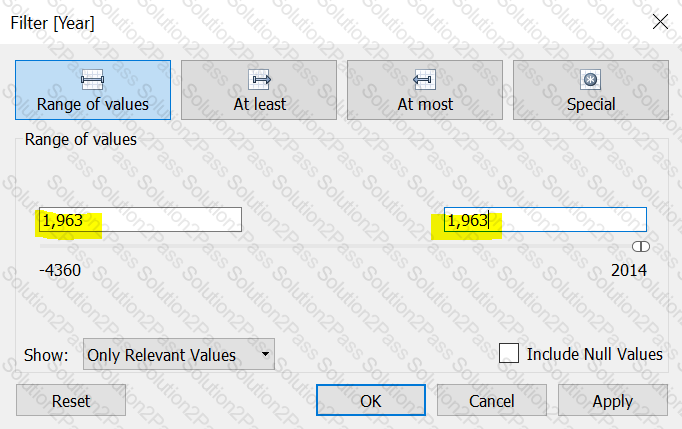 Graphical user interface
Description automatically generated
Graphical user interface
Description automatically generated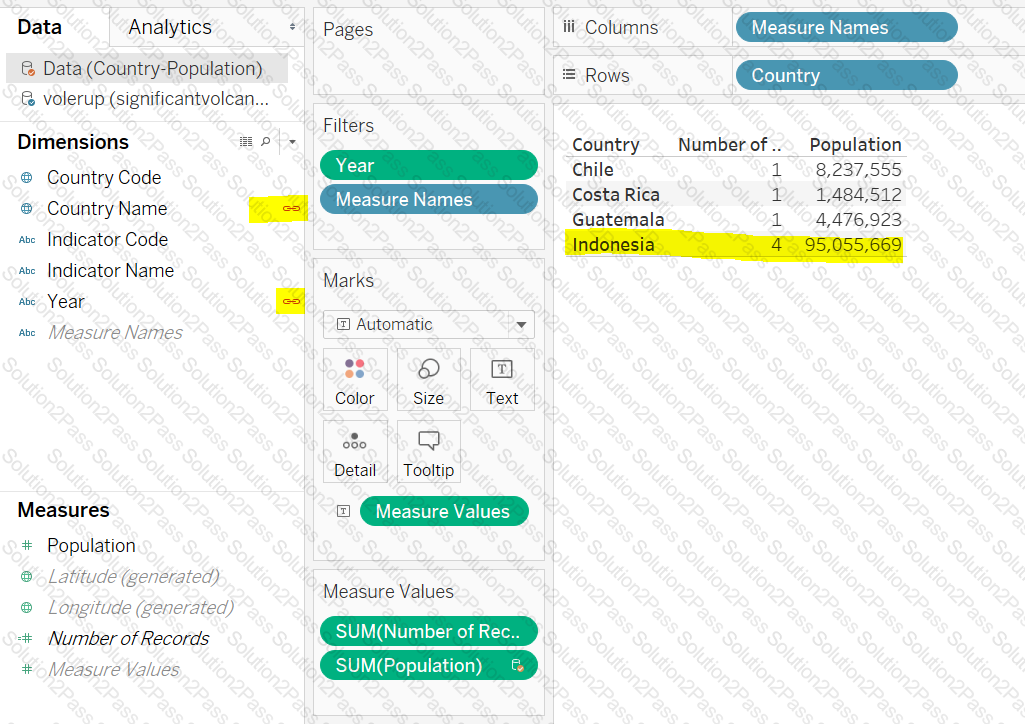 Graphical user interface, text, application, chat or text message
Description automatically generated
Graphical user interface, text, application, chat or text message
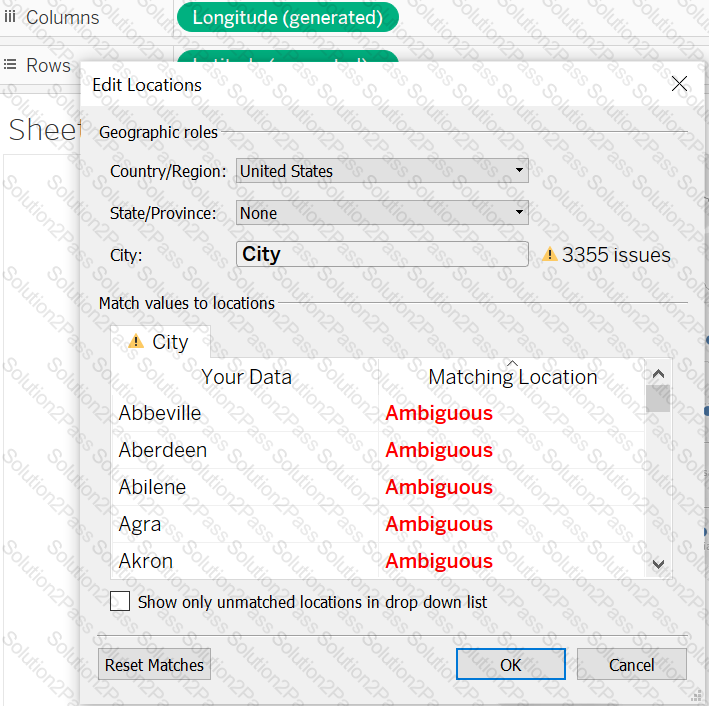
Description automatically generatedYou need to create a filled map using the City field, you drop the City field to your view. And you get the location error 'Ambigious', what does it mean, and how you will fix this issue?
Larger image
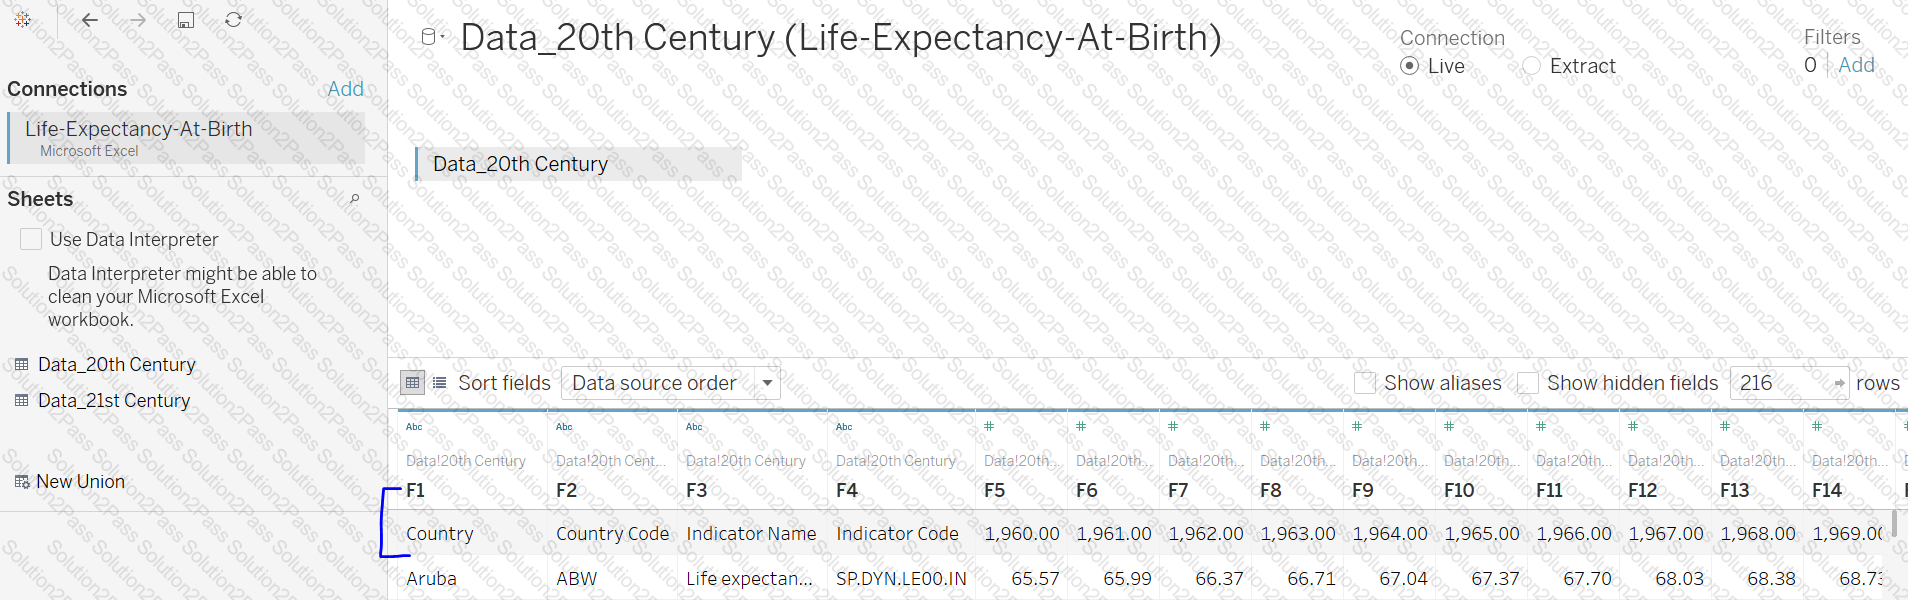
Connect to the "Life Expectancy at birth" data source, combine sheets Data_20th century and Data_21st century. Find the moving average for the average life expectancy for 10 years before 2000 and 10 years after 2000 for New Zealand.
 Graphical user interface, application
Description automatically generated
Graphical user interface, application
Description automatically generated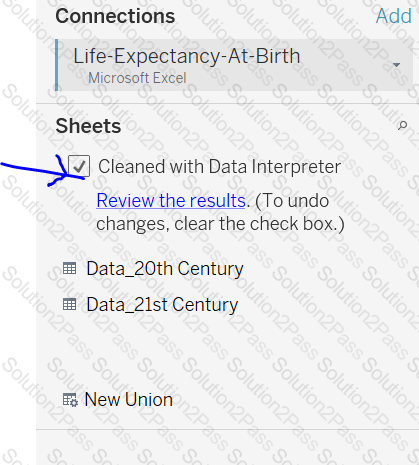 Graphical user interface, text, application
Description automatically generated
Graphical user interface, text, application
Description automatically generated Graphical user interface, text, application
Description automatically generated
Graphical user interface, text, application
Description automatically generated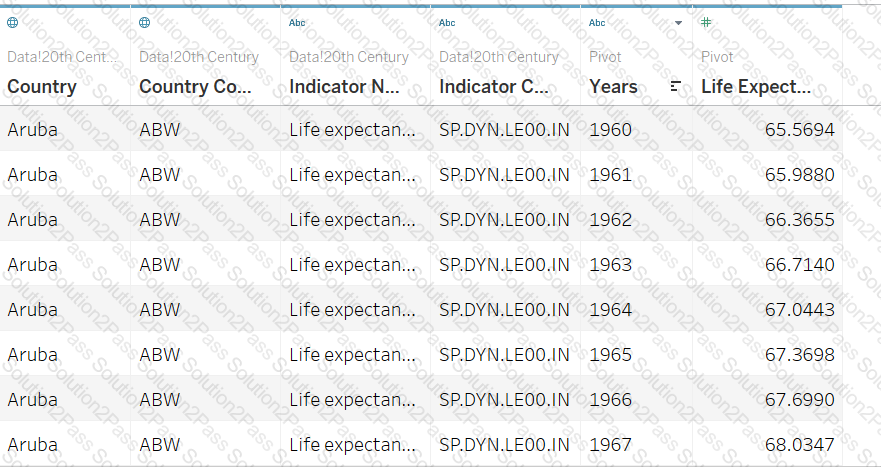 Graphical user interface, application
Description automatically generated
Graphical user interface, application
Description automatically generated Graphical user interface, text, application, email
Description automatically generated
Graphical user interface, text, application, email
Description automatically generated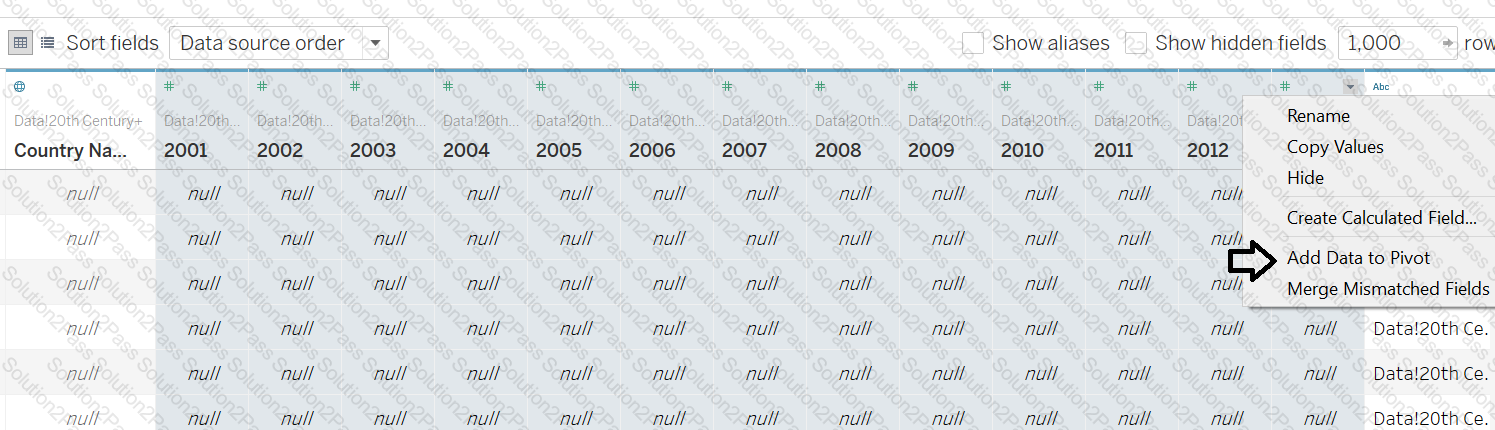 A picture containing graphical user interface
Description automatically generated
A picture containing graphical user interface
Description automatically generated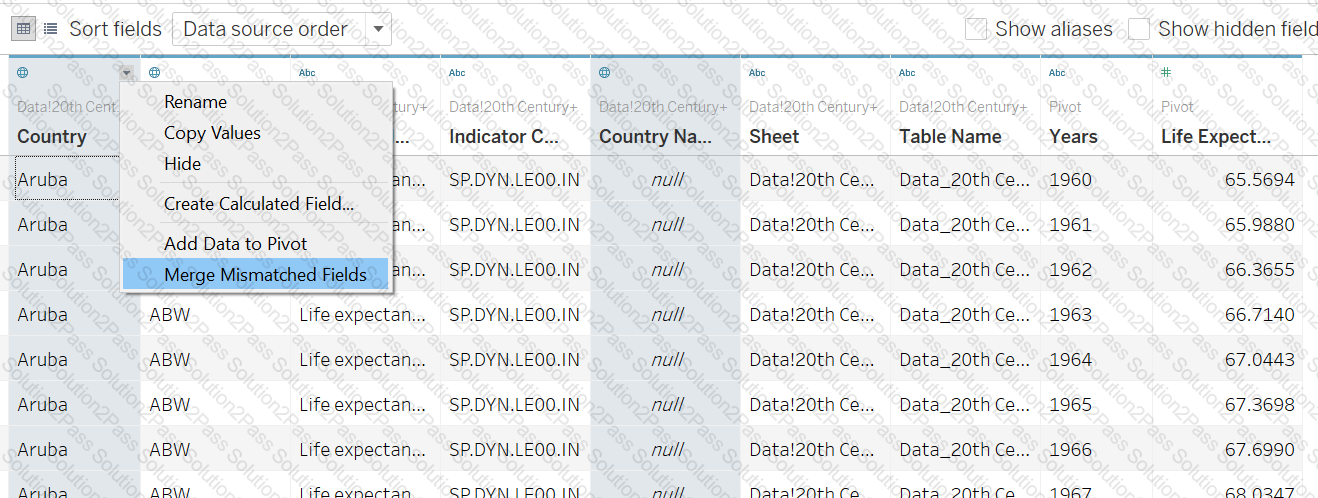 Graphical user interface, application
Description automatically generated
Graphical user interface, application
Description automatically generated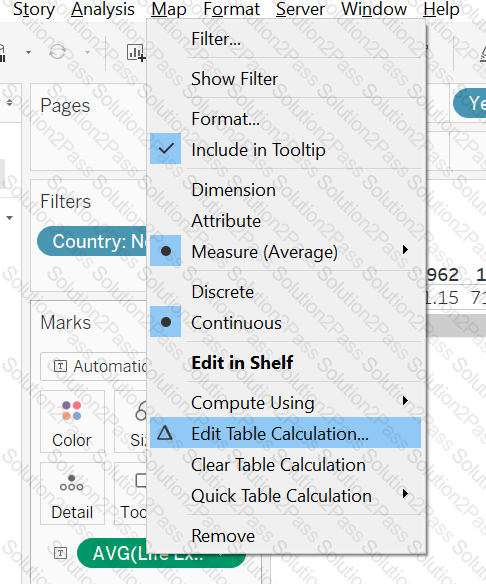 Graphical user interface, application
Description automatically generated
Graphical user interface, application
Description automatically generated Graphical user interface, application, Word
Description automatically generated
Graphical user interface, application, Word
Description automatically generated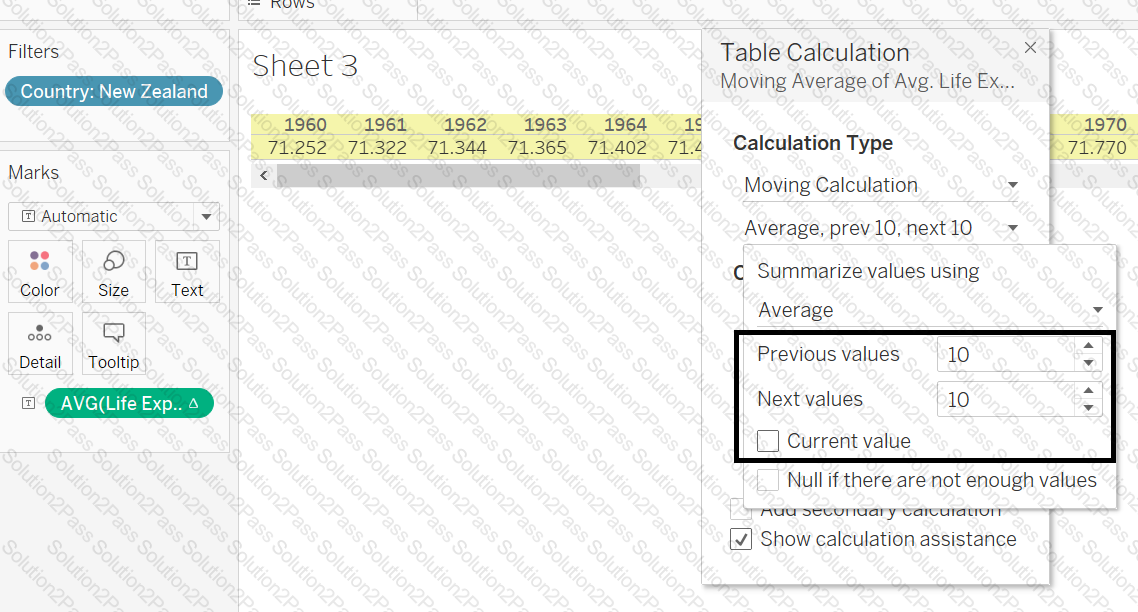 Graphical user interface, application, Word
Description automatically generated
Graphical user interface, application, Word
Description automatically generatedWhich of the following are true when you use the cube data source in Tableau?
Which of the following are true regarding the data highlighter in Tableau?
You can turn on the highlighter for any field available in your view.
 Table
Description automatically generated
Table
Description automatically generated
If you update the underlying data source for your view the data shown in the highlighter is automatically updated too.
If you have multiple highlighters showing on a dashboard, only one highlighter can be active at a time.
If you want to change the format for the highlighter card after you turn it on, select Format > Highlighter.
Connect to the "Global Superstore" data source and create a view to show only those orders which were returned. What is the unique number of orders returned in the North Africa region in the office supplies category? Consider only those orders which were shipped using Standard Class ship mode.
 Graphical user interface, application
Description automatically generated
Graphical user interface, application
Description automatically generated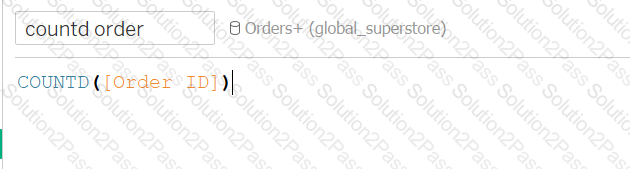 Graphical user interface, text, application
Description automatically generated
Graphical user interface, text, application
Description automatically generated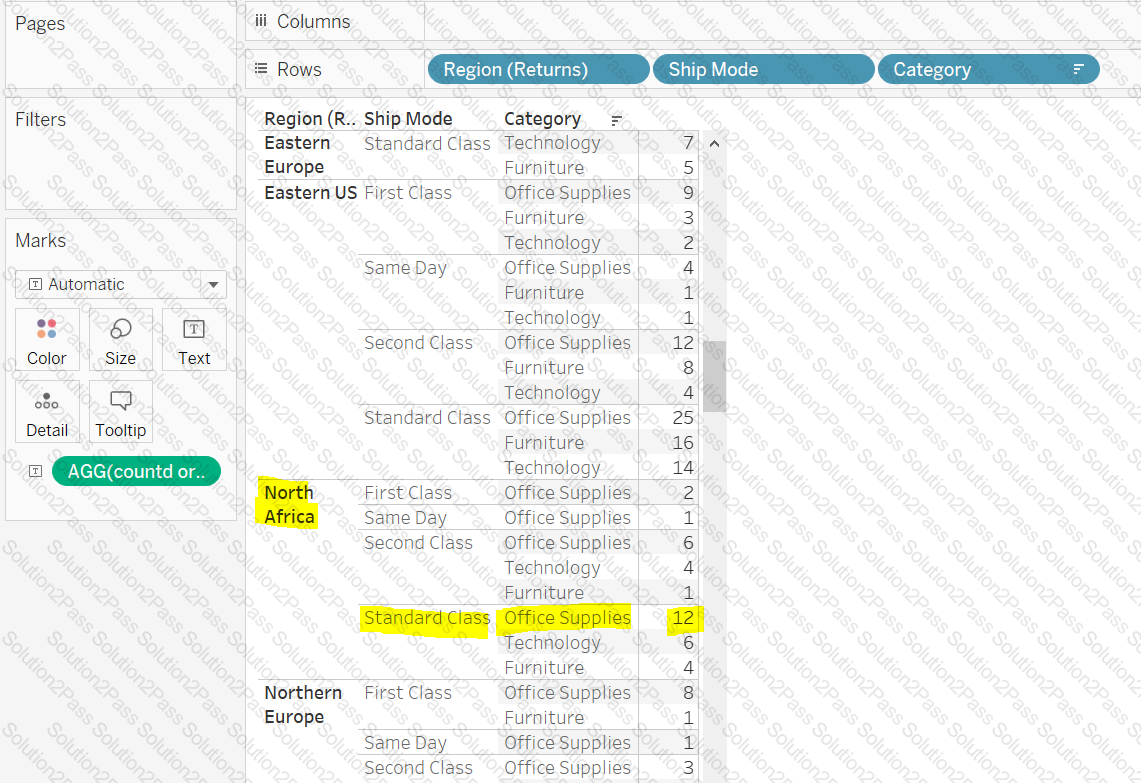 Graphical user interface, text, application
Description automatically generated
Graphical user interface, text, application
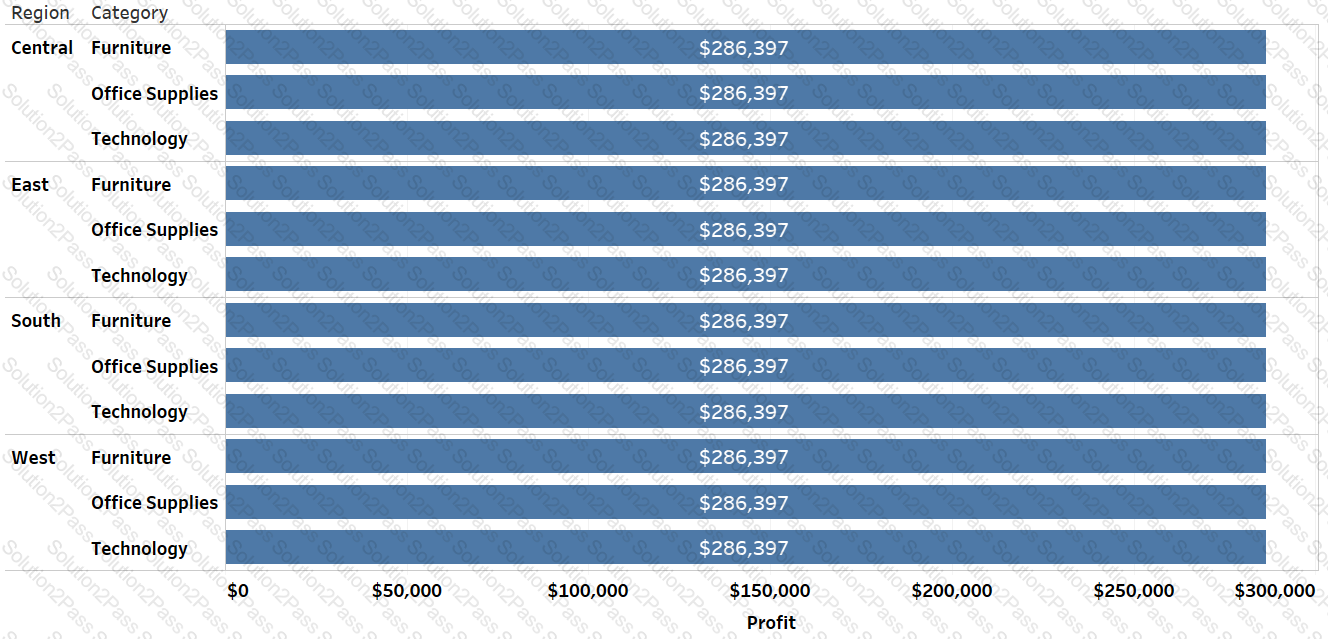
Description automatically generatedWhich LOD calculations can be used in Columns shelf to create this view?
Larger image
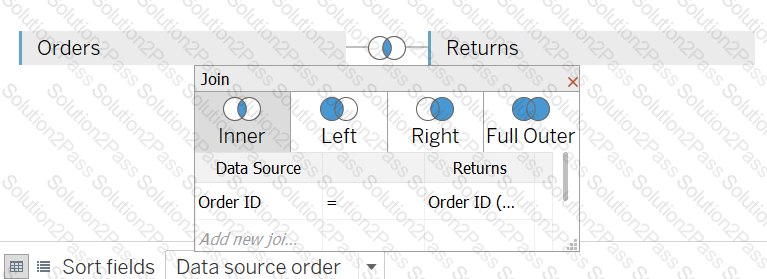
You have connected to the employee table in your data source and are adding a join on the Employee Manager table. If you would like to see all of the records from the employee table and only matching records from the employee manager table. Which join type will you use?
Connect to the "Global Superstore" data source and use the Orders table. Predict the profit of January 2016 using the profit data through December 2015. What is the profit value of January 2016?
 Graphical user interface, text, application
Description automatically generated
Graphical user interface, text, application
Description automatically generated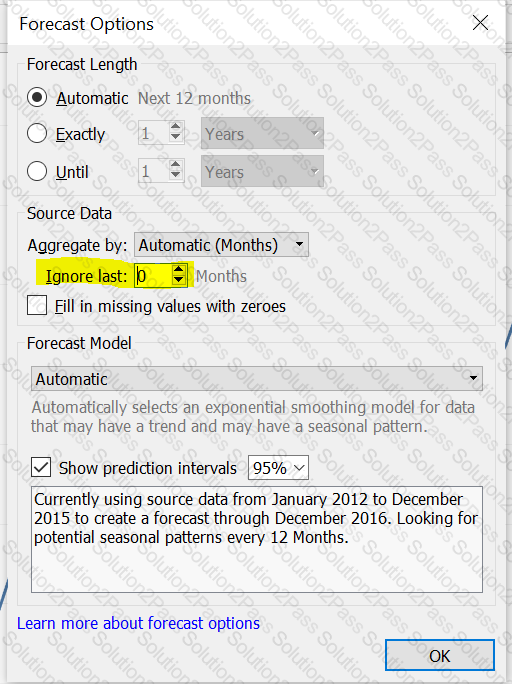 Graphical user interface, text, application
Description automatically generated
Graphical user interface, text, application
Description automatically generated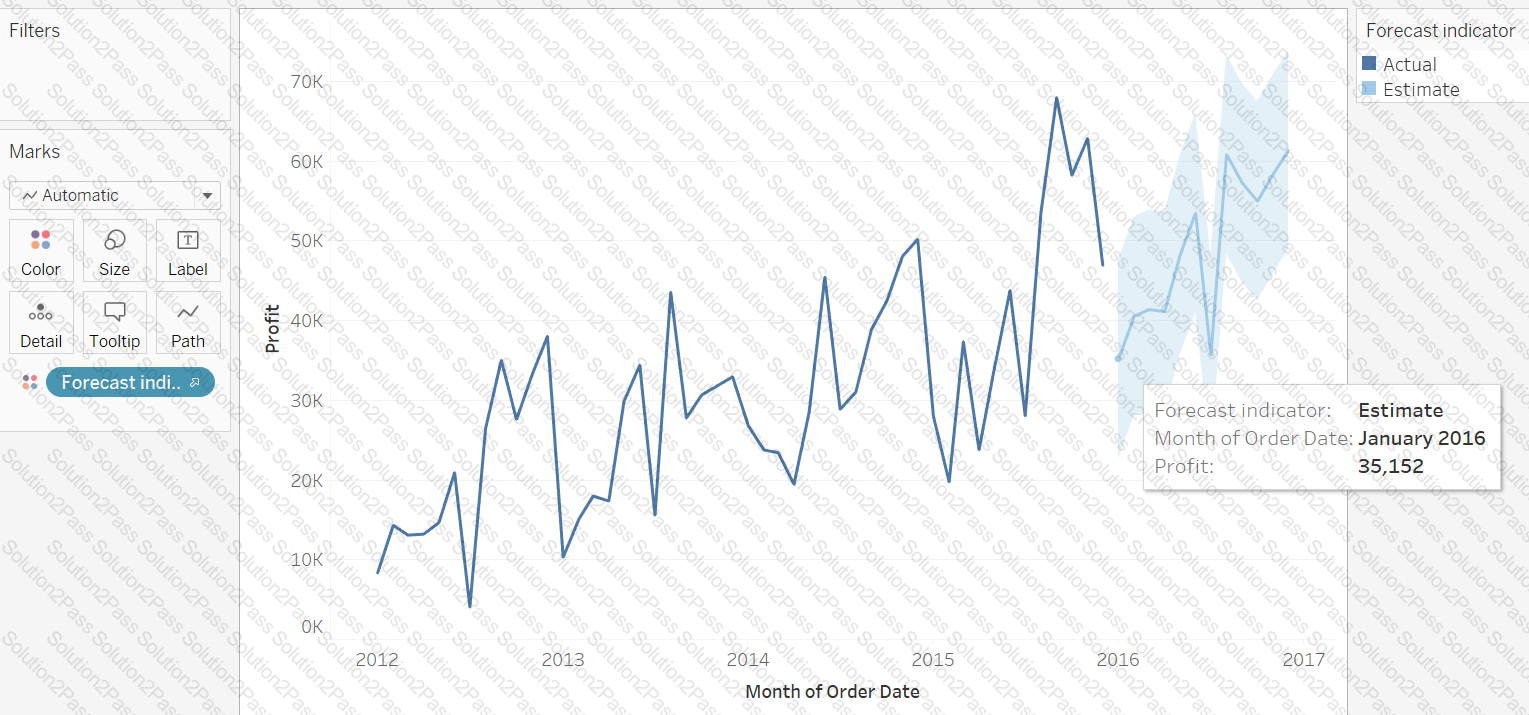 Graphical user interface, chart, line chart
Description automatically generated
Graphical user interface, chart, line chart
Description automatically generatedWhy we convert a numeric measure to a dimension?
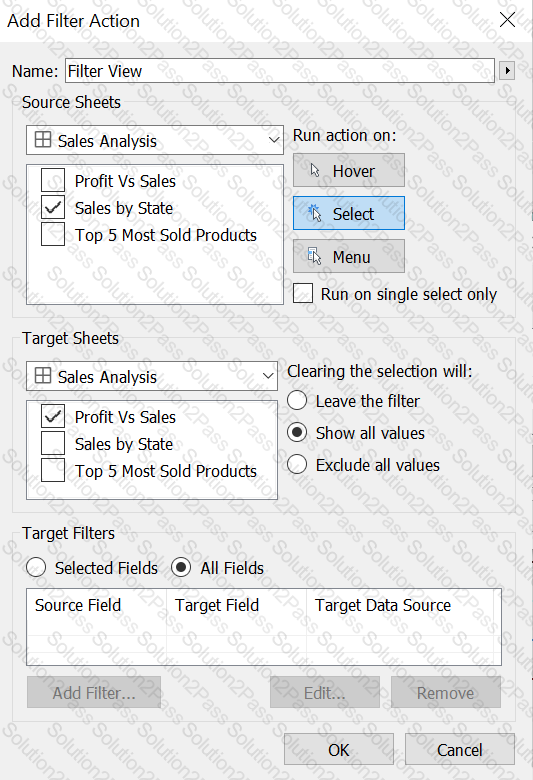
Using the Sales Analysis Dashboard, create a filter action that will trigger once you select any state in Sales by State View, and it should update the Profit Vs Sales view. Find out using trend lines in the Profit Vs Sales view, how much does profit increase for each dollar of sales for the California state?
 Graphical user interface
Description automatically generated
Graphical user interface
Description automatically generated Map
Description automatically generated
Map
Description automatically generatedTotal 108 questions
