Desktop-Specialist Tableau Desktop Specialist Exam Free Practice Exam Questions (2026 Updated)
Prepare effectively for your Tableau Desktop-Specialist Tableau Desktop Specialist Exam certification with our extensive collection of free, high-quality practice questions. Each question is designed to mirror the actual exam format and objectives, complete with comprehensive answers and detailed explanations. Our materials are regularly updated for 2026, ensuring you have the most current resources to build confidence and succeed on your first attempt.
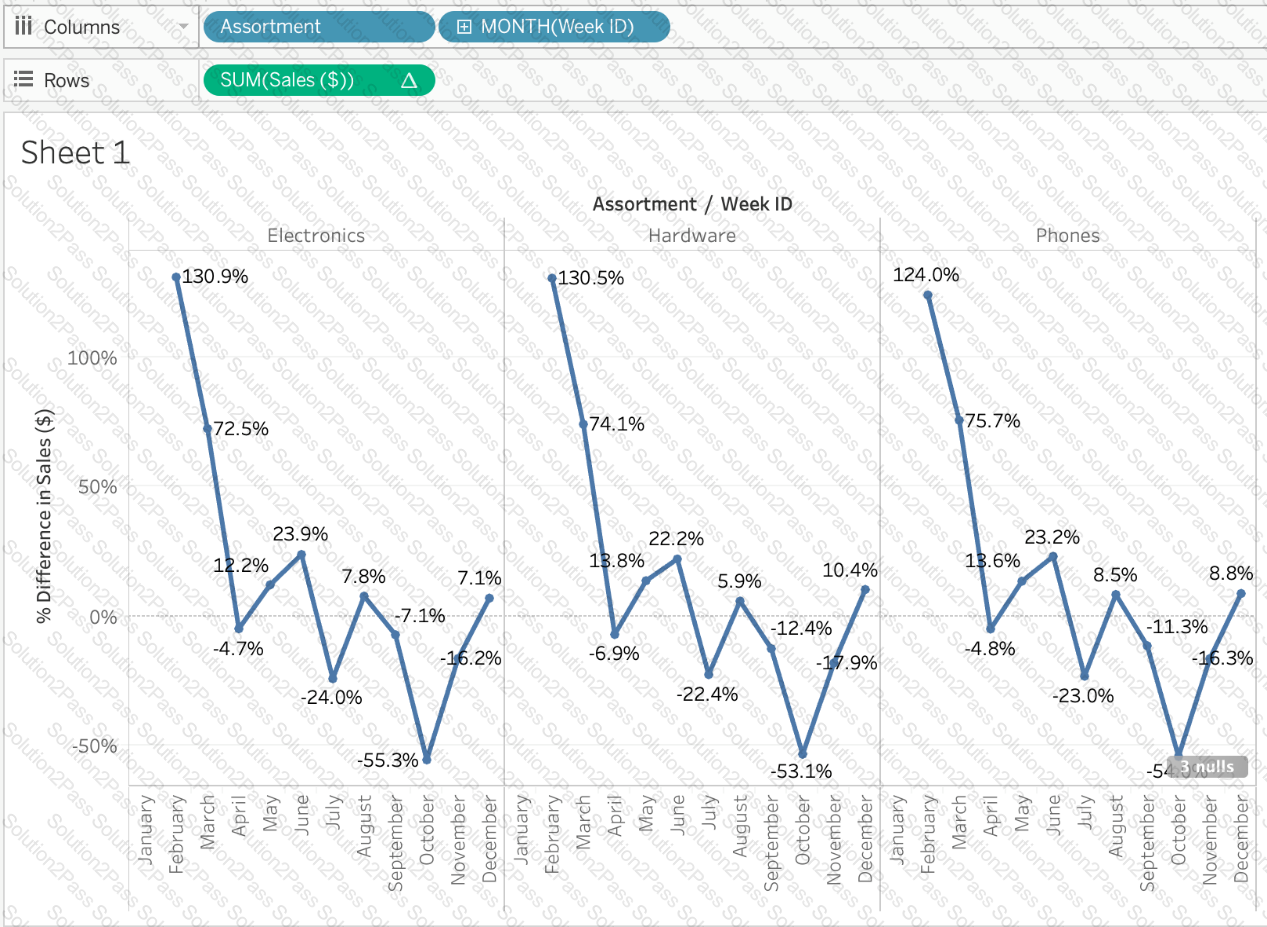
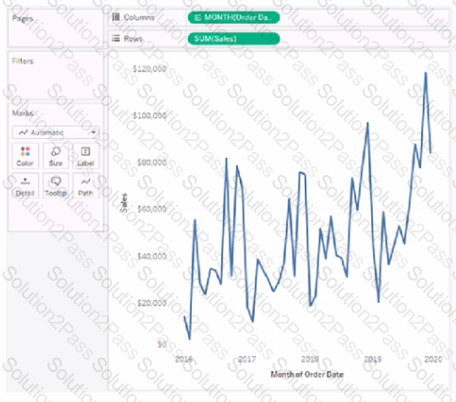
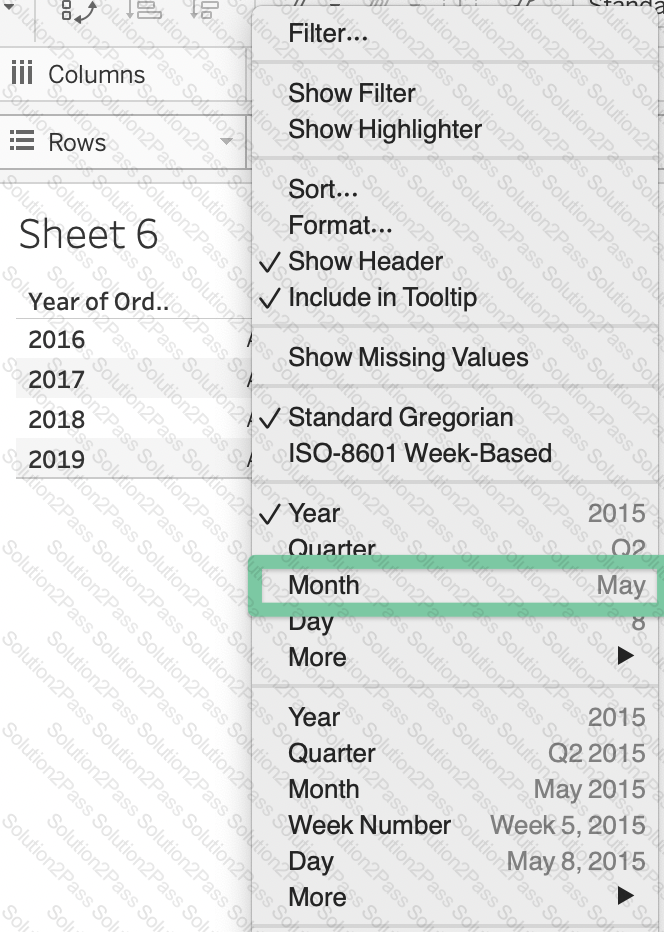
Using the Time Series Table, create a Line chart showing the Monthly Year over Year Growth for the Sales, broken down by Assortment. For the Electronics assortment, which Month had the most NEGATIVE value of Year over Year Growth?
Using the Time Series Table, create a Line chart showing the Monthly Year over Year Growth for the Sales, broken down by Assortment. For the Electronics assortment, which Month had the most NEGATIVE value of Year over Year Growth?
You need to create a calculation that returns a customer name followed by a comma, a space, and then the customer's age (for example: John Doe, 32).
What should you include in the calculation?
Which statement accurately describes aliases?
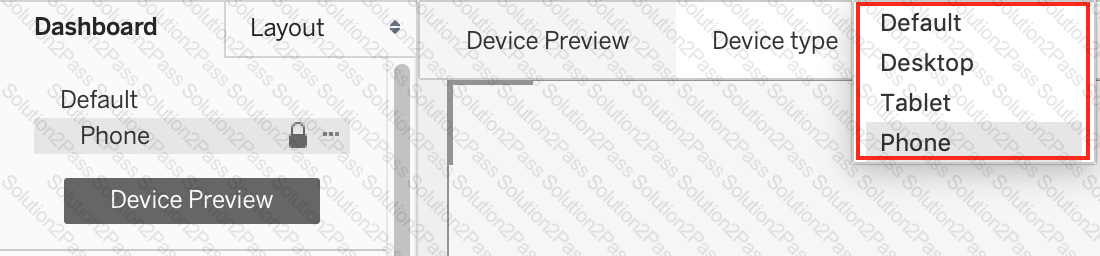
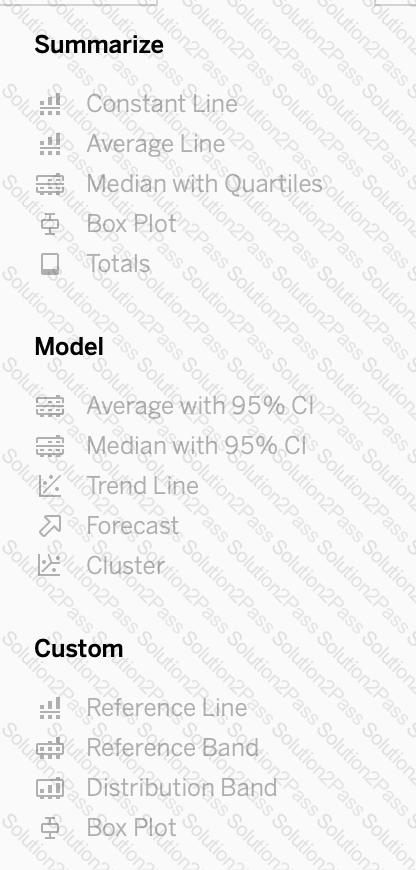
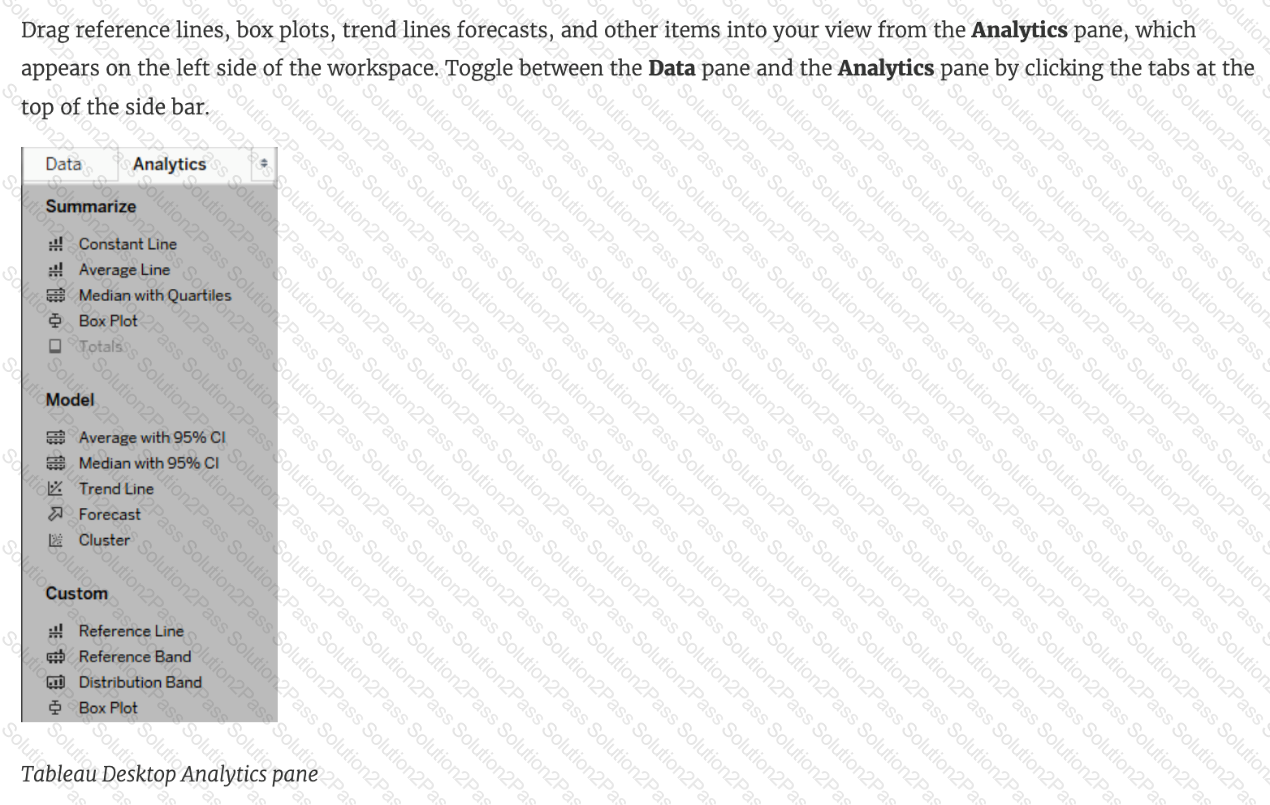
When creating a dashboard for multiple devices, which of the following Device options are available in the Device Preview section?
 Graphical user interface
Description automatically generated
Graphical user interface
Description automatically generatedWhen creating a histogram in Tableau, to what does bin size refer?
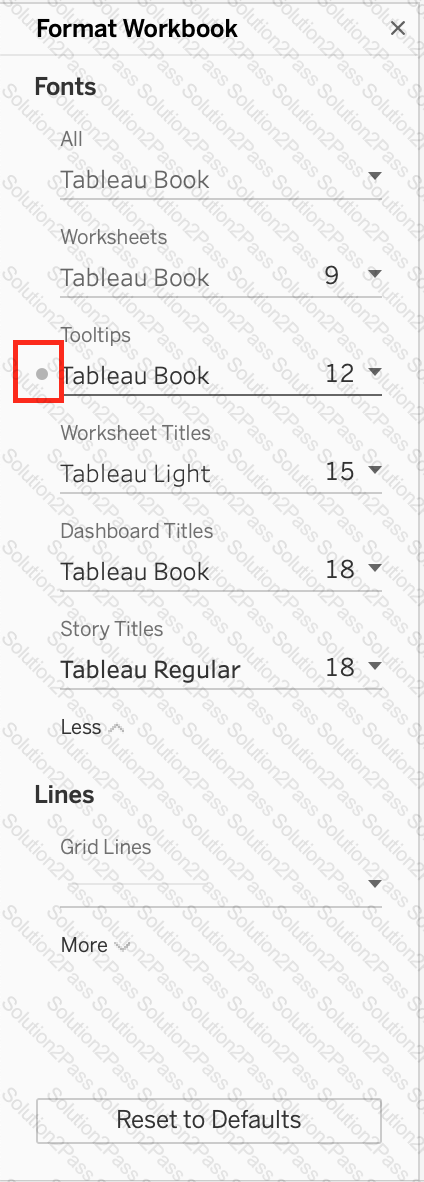
Which of the following are valid ways to make the font more readable in Tableau?
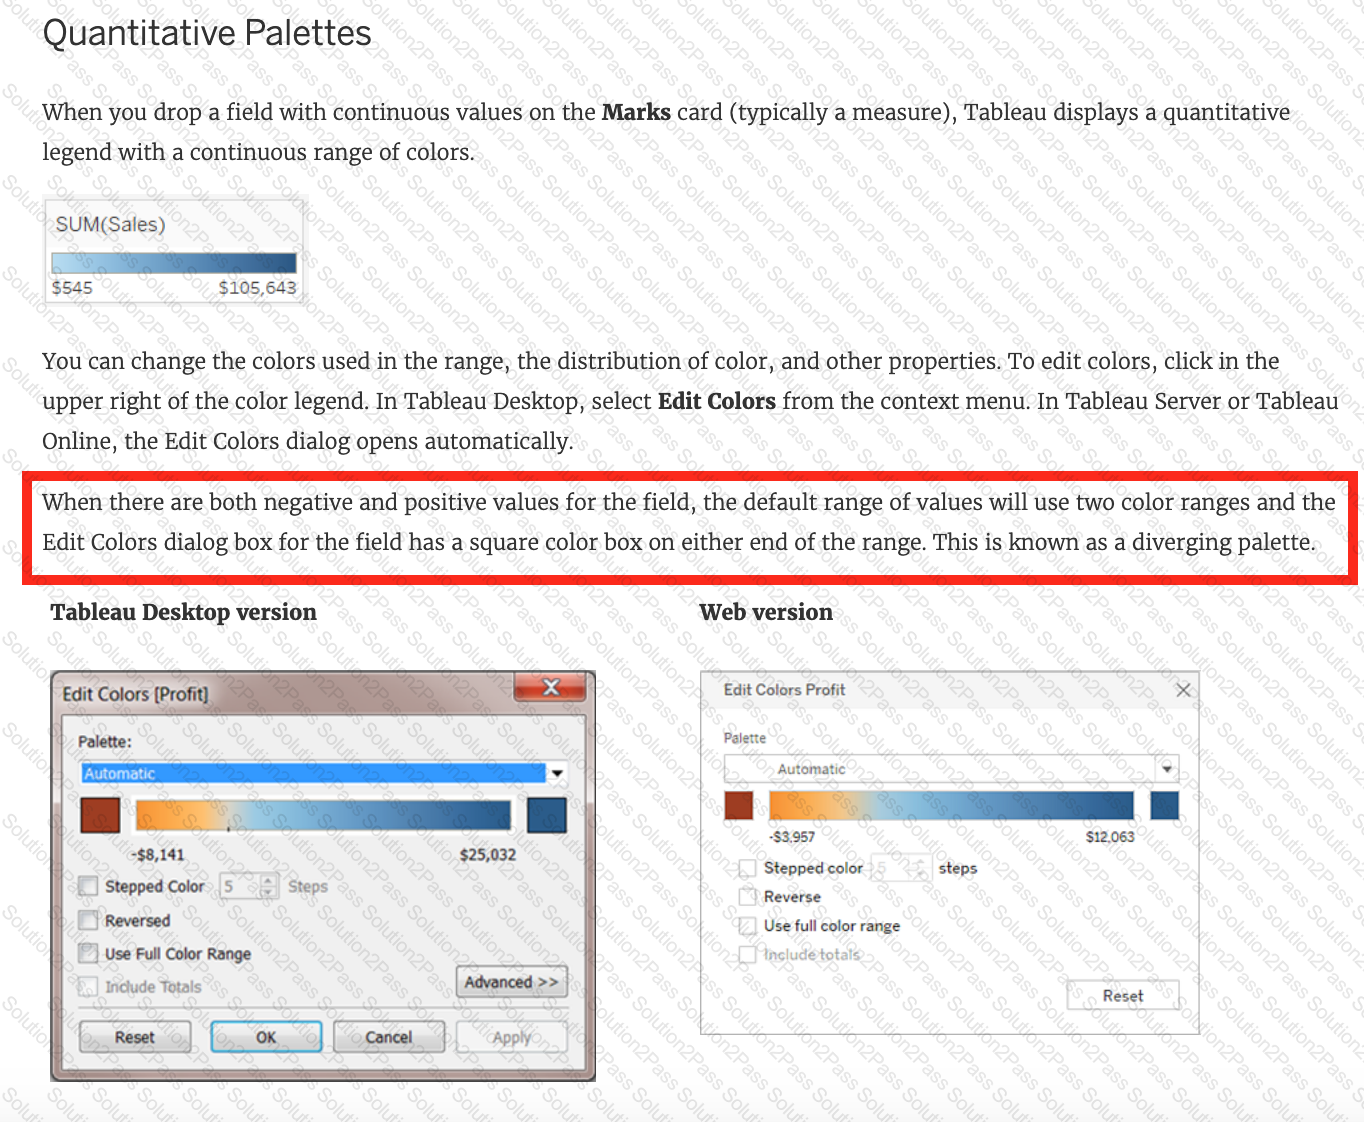
When there are both negative and positive values for a field, the default range of values will use two color ranges. This is known as a ______________ palette.
From which three locations can you sort a visualization? Choose three.
What will the following function return?
LEFT("Tableau", 3)

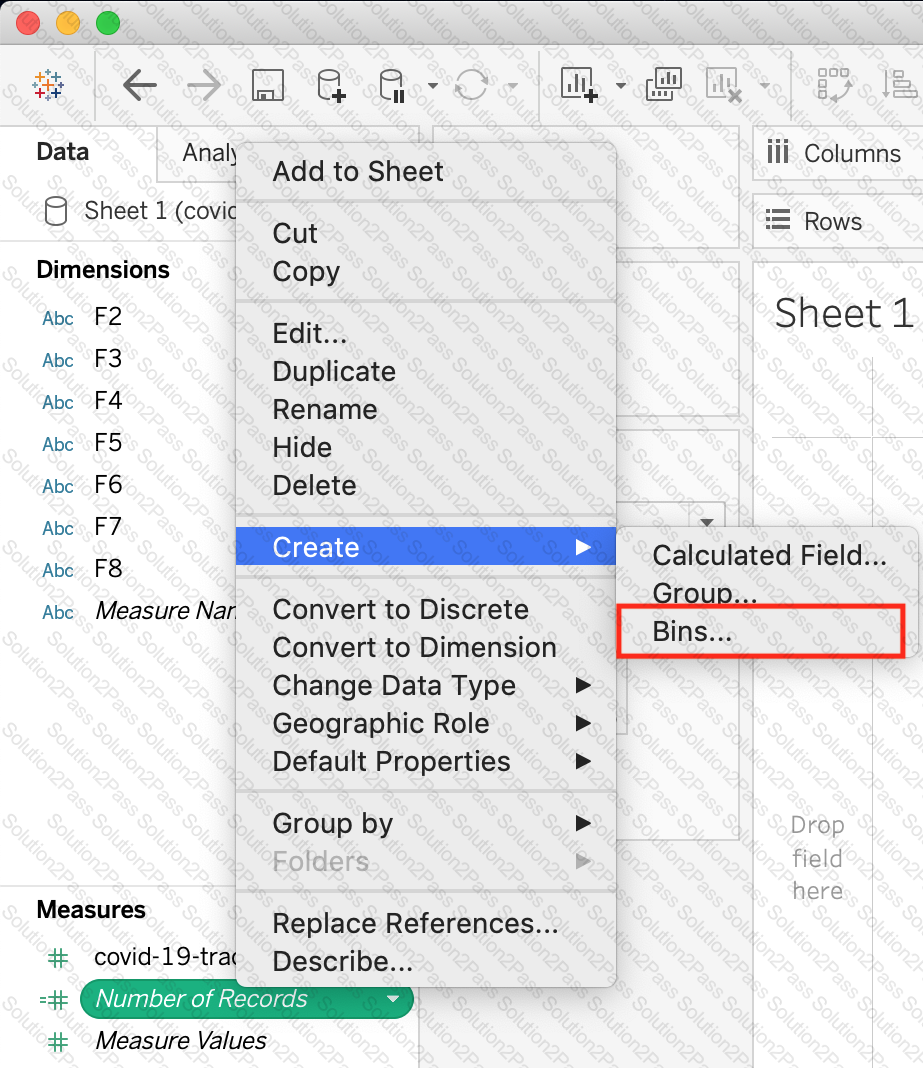
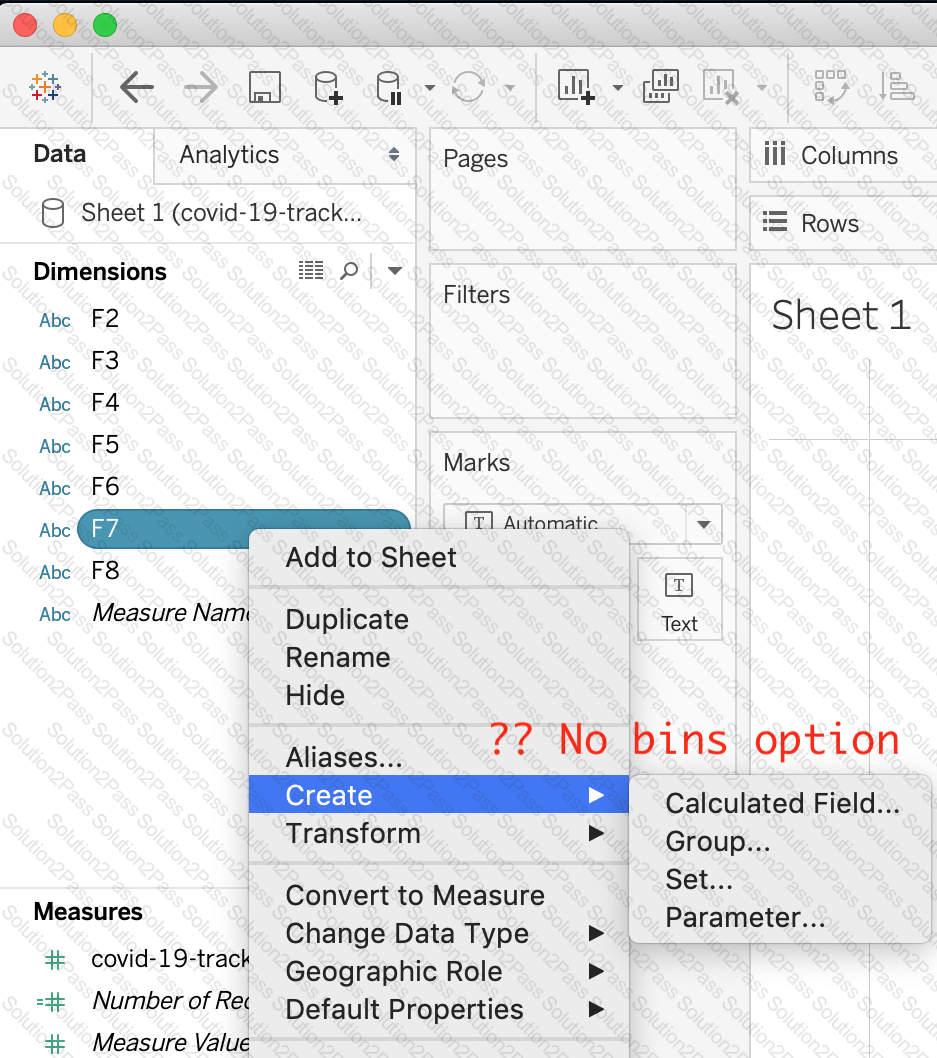
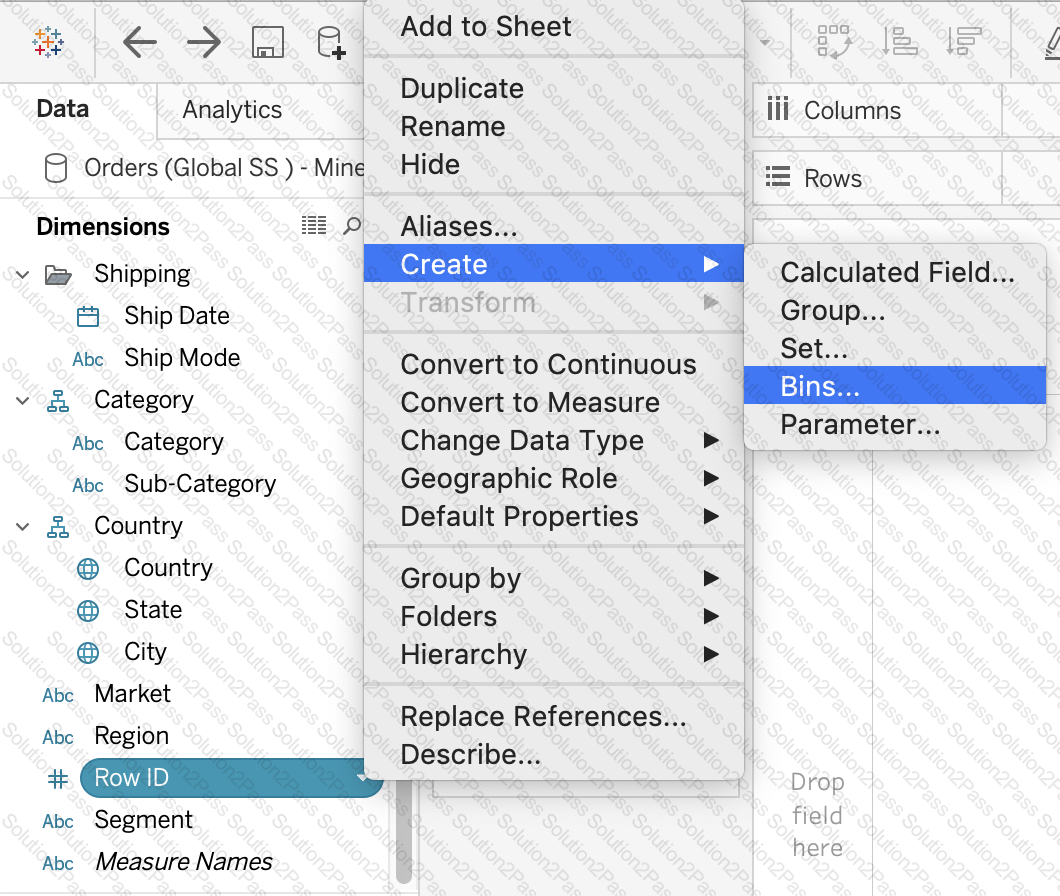
True or False : Bins can be created on dimensions
You have a workbook that contains one data source and you need to combine data from another database. What should you do first?
Given a map, which of the following fields can be placed in Size,Shape,Detail,Color
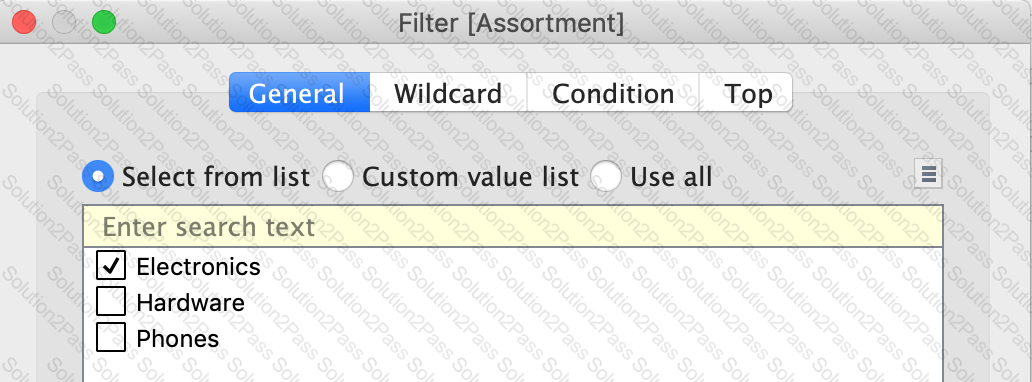
When you want to first apply a filter and THEN show the Top N or Bottom N elements, which of the following filters would you use?
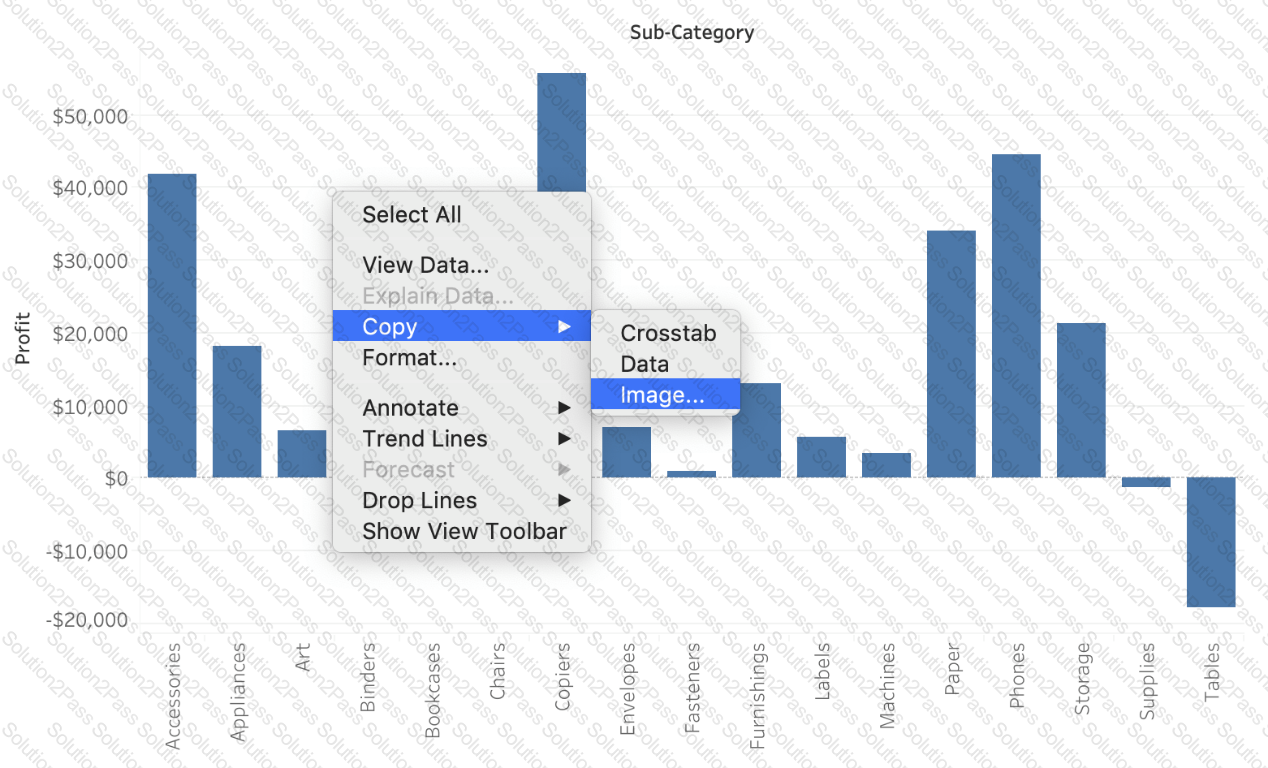
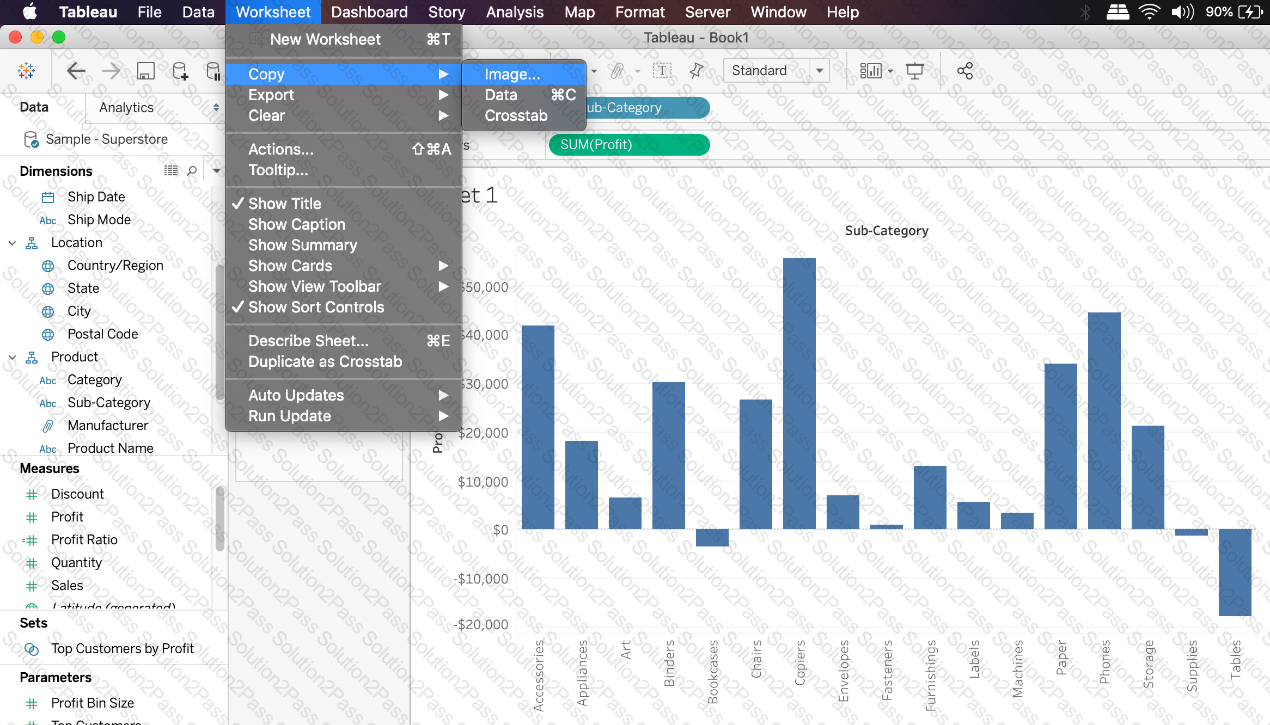
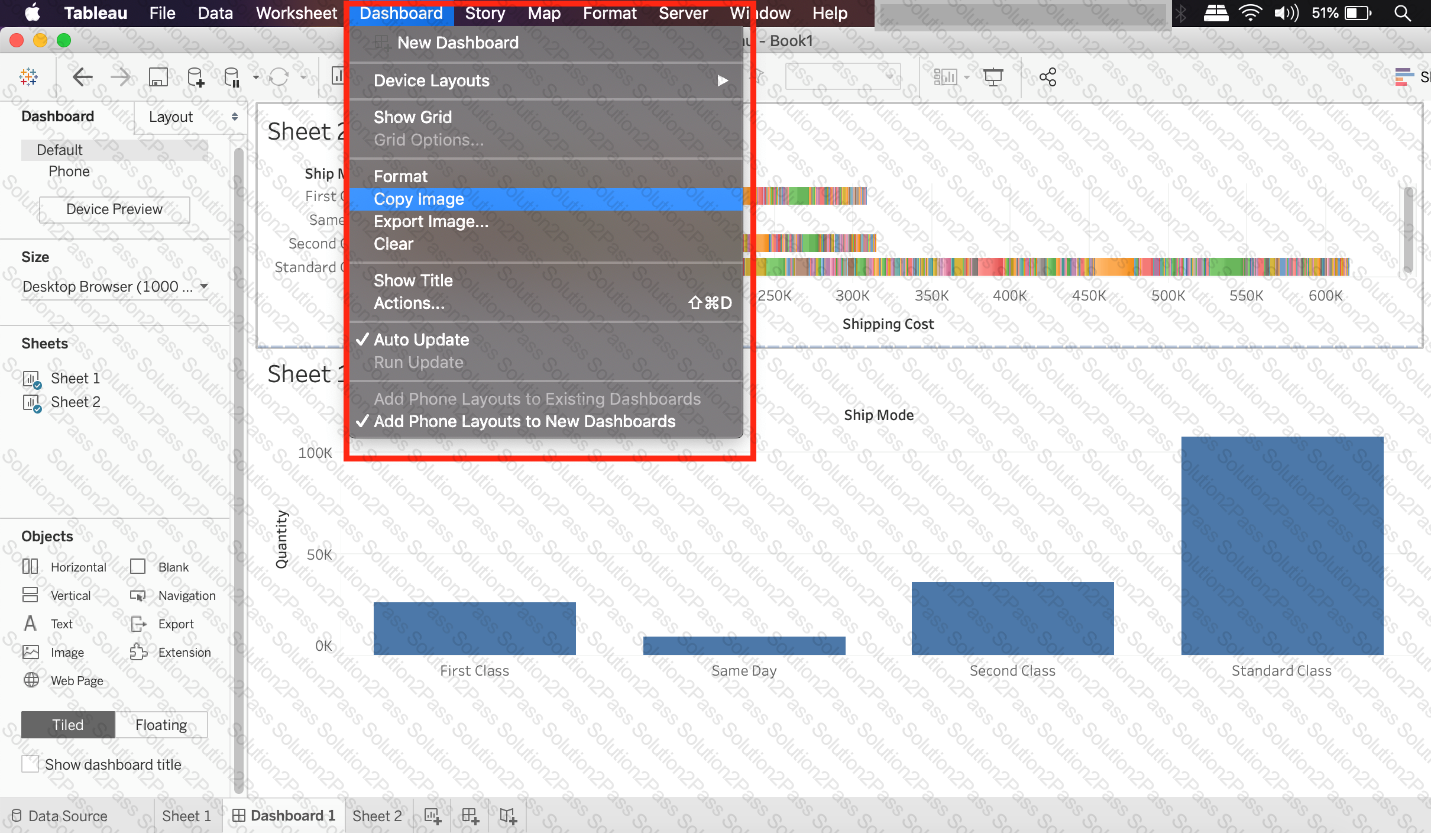
Which of the following are valid ways to export a dashboard with multiple visualisations as an image?
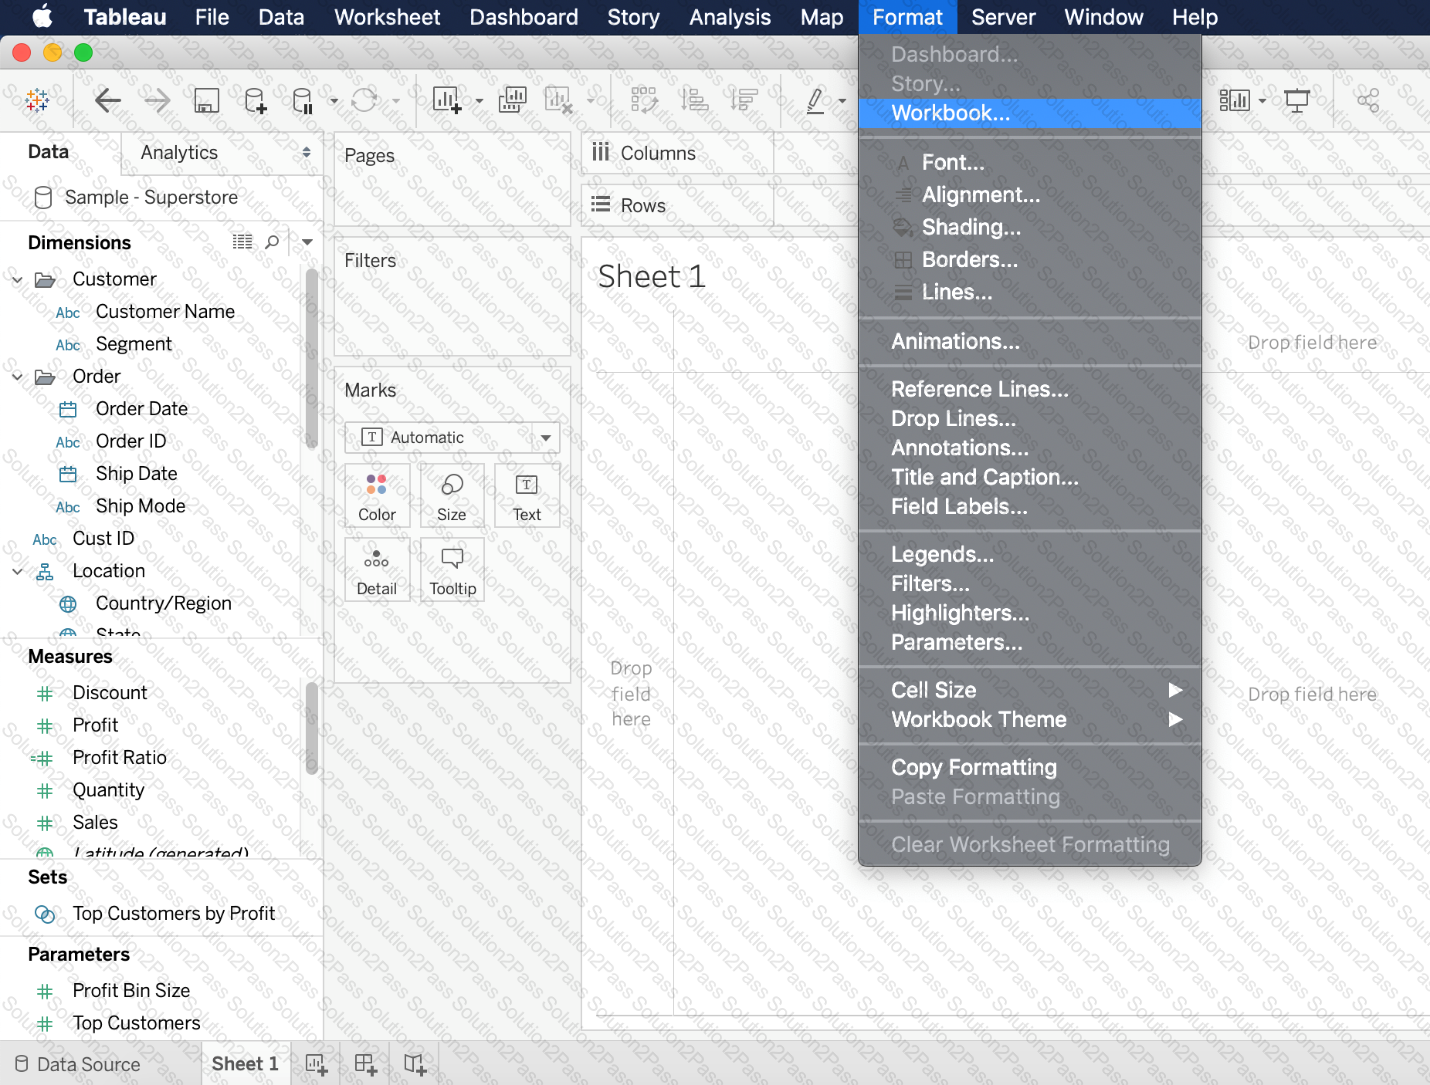
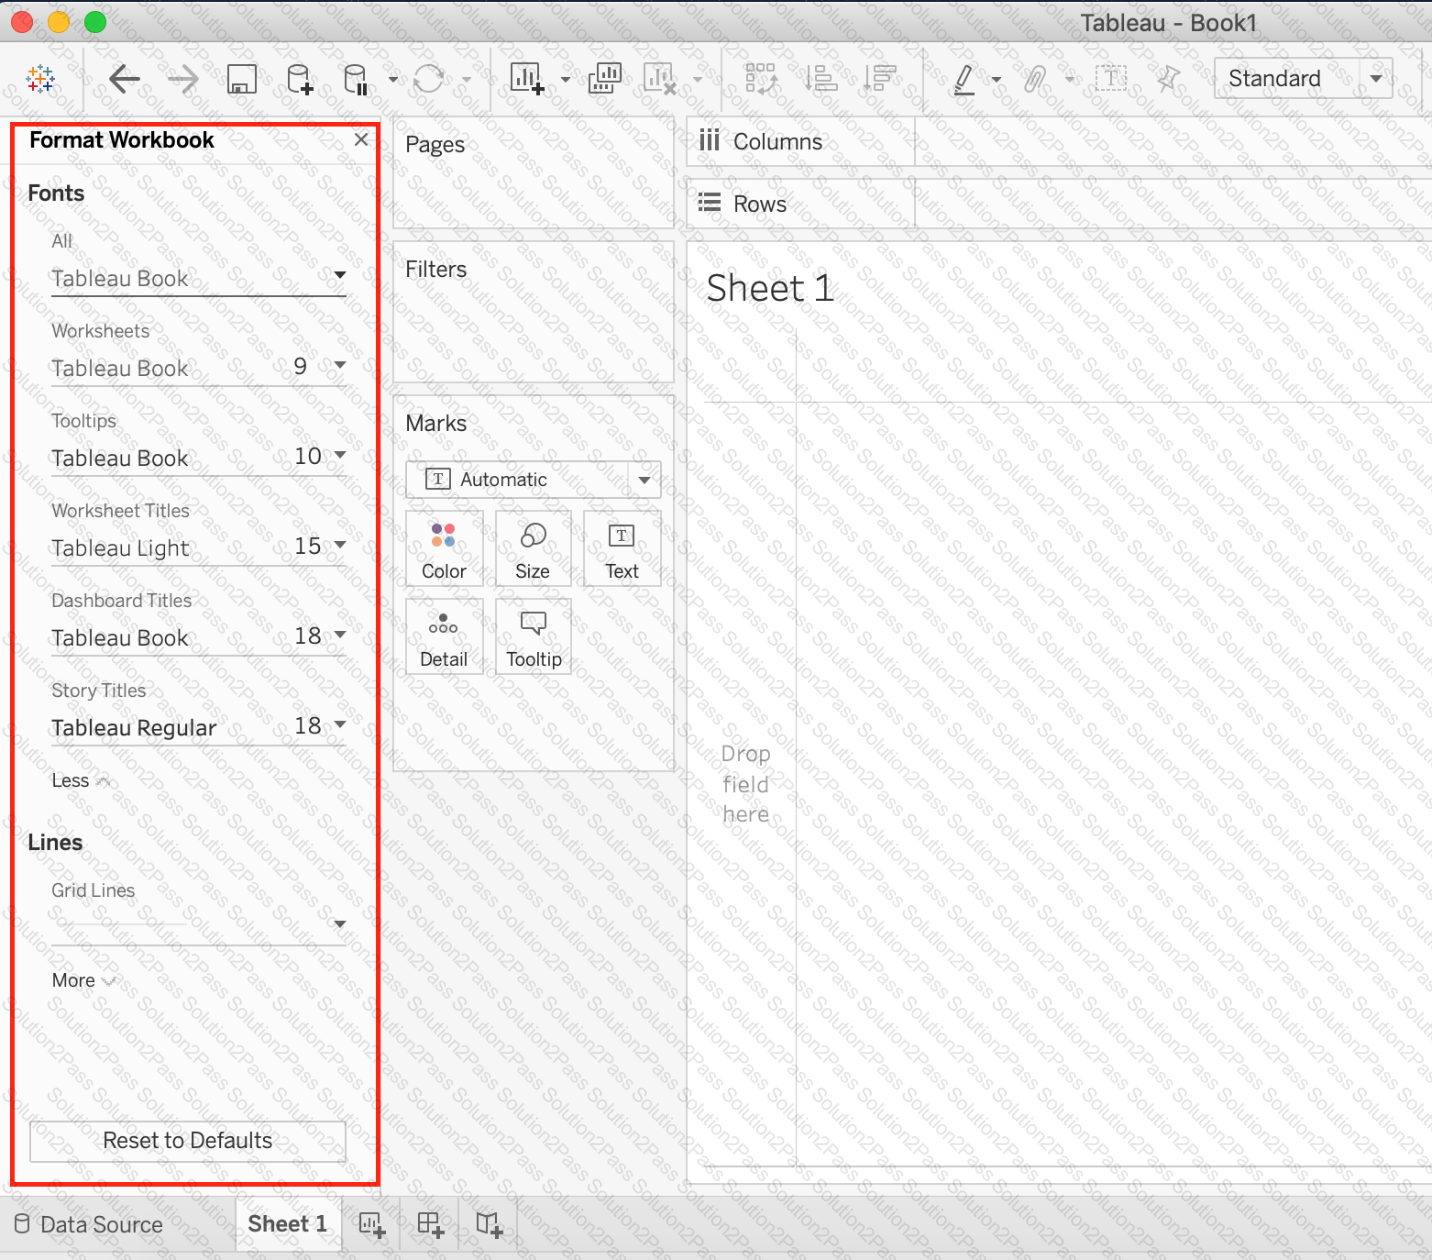
Which of the following describes the best way to change the formatting at a workbook level?
 Graphical user interface, application
Description automatically generated
Graphical user interface, application
Description automatically generatedLarger image
What is this entire view referred to as in Tableau?
You have the following visualization.
Where should you place a field named Region to show multiple distinct lines on the same axis?
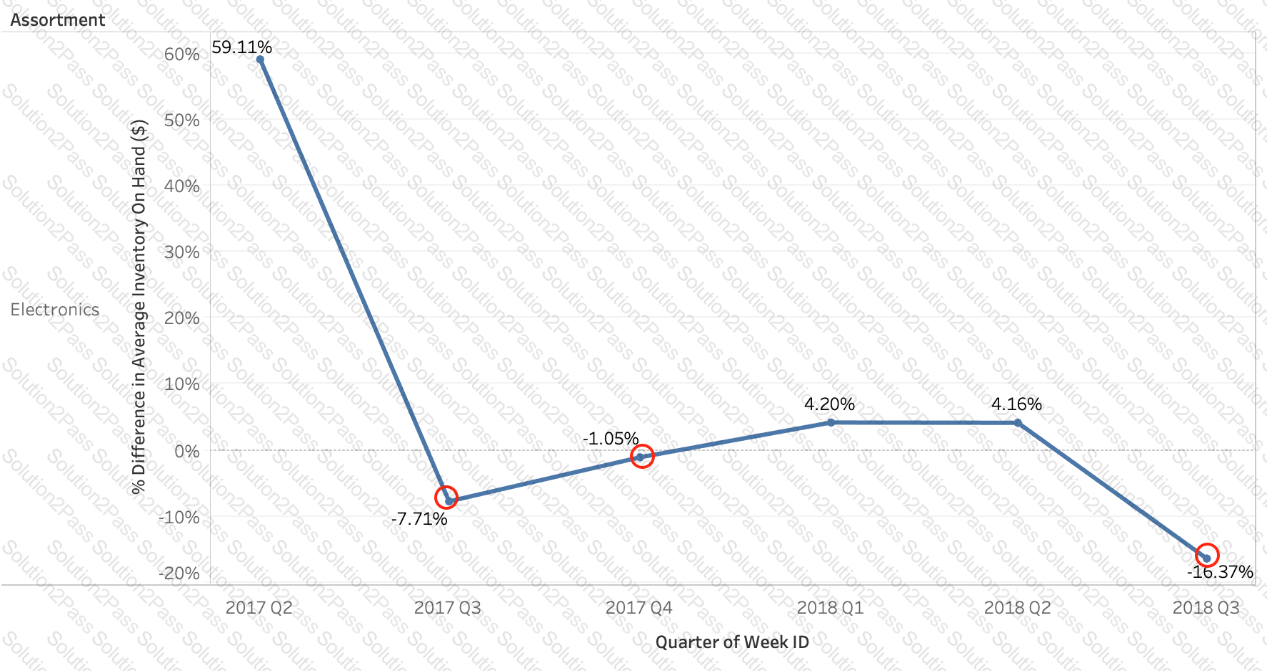
Using the Time Series table, create a chart that shows the percent difference in Average Inventory on Hand for each Assortment by year and quarter.
How many quarters did the Electronics Assortment show a negative percent difference in the Average Inventory On Hand?
Which of the following is an example of a Date Part?
Which of the following are valid ways to copy a worksheet visualisation as an image?