Desktop-Specialist Tableau Desktop Specialist Exam Free Practice Exam Questions (2026 Updated)
Prepare effectively for your Tableau Desktop-Specialist Tableau Desktop Specialist Exam certification with our extensive collection of free, high-quality practice questions. Each question is designed to mirror the actual exam format and objectives, complete with comprehensive answers and detailed explanations. Our materials are regularly updated for 2026, ensuring you have the most current resources to build confidence and succeed on your first attempt.
By default, measures placed in a view are aggregated by ______________
You need to uniformly change the size for all marks in a view.
What should you do?
Which of the following is a benefit of using a Tableau Data Source (.tds)?
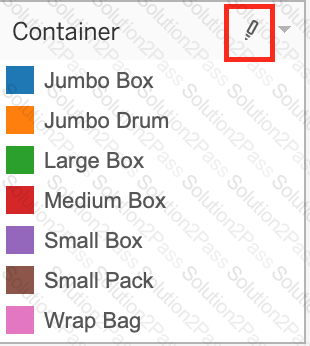
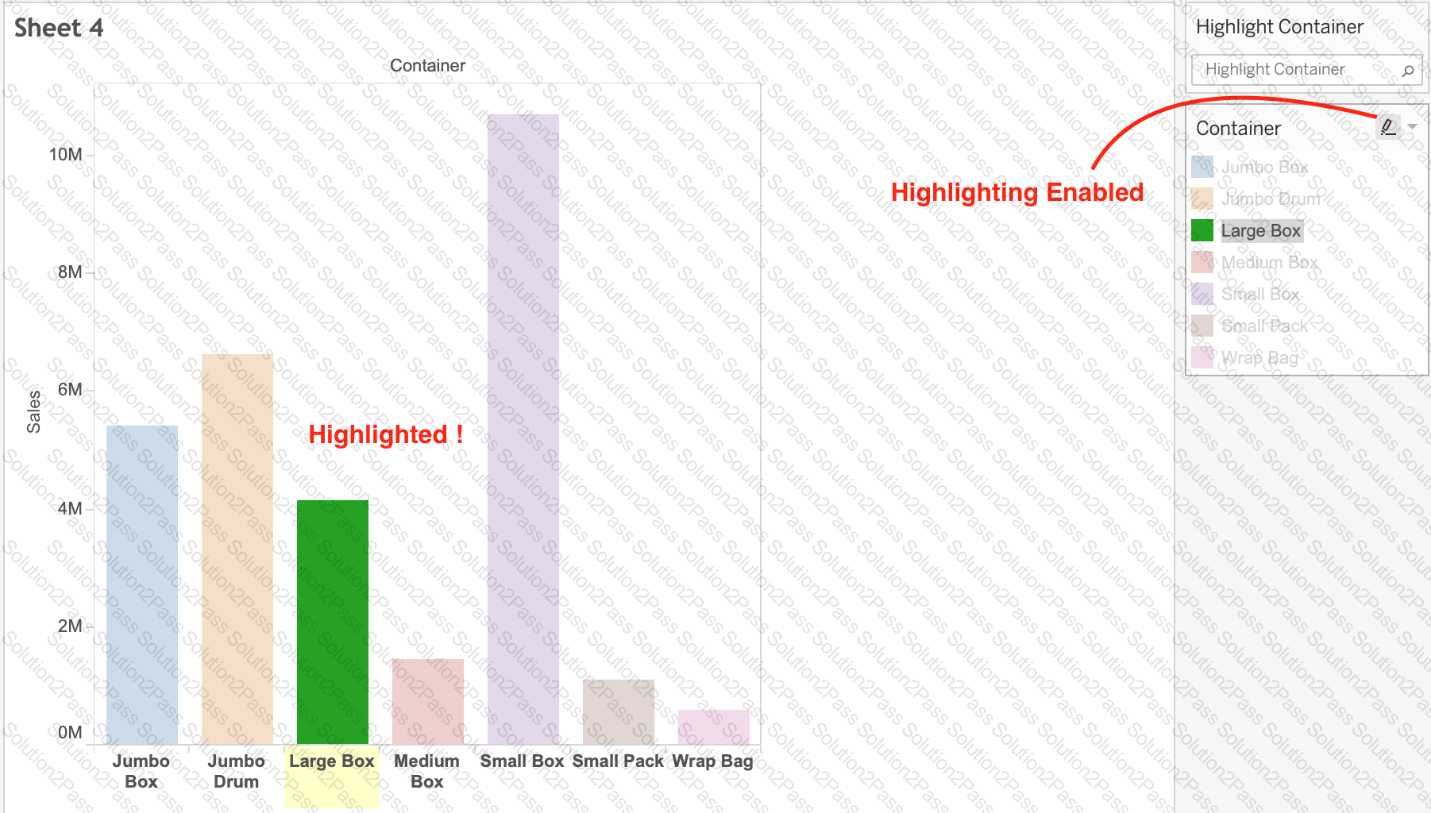
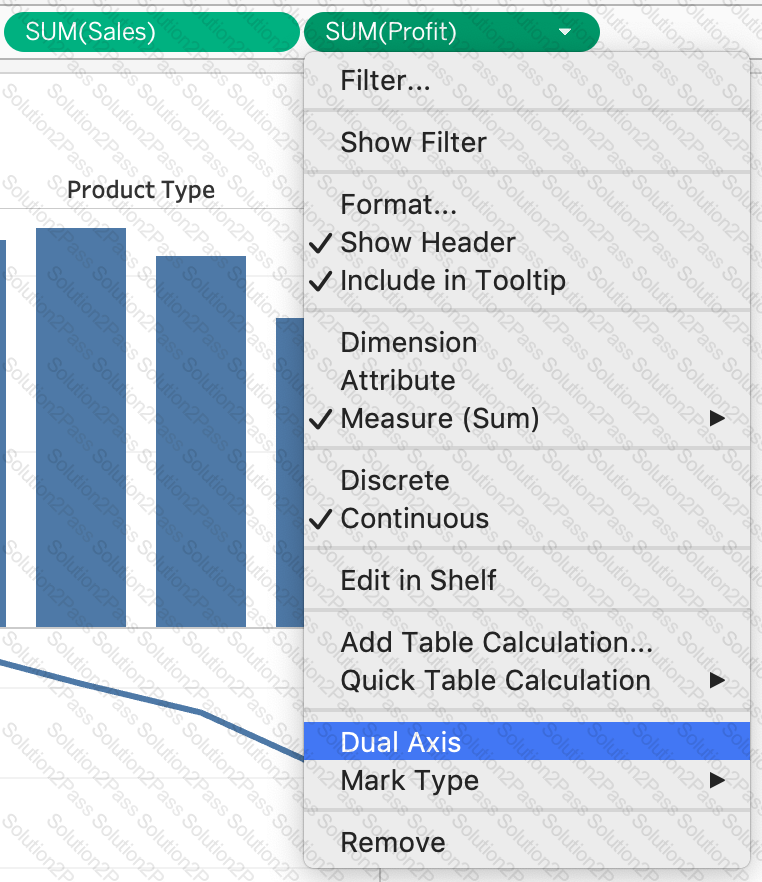
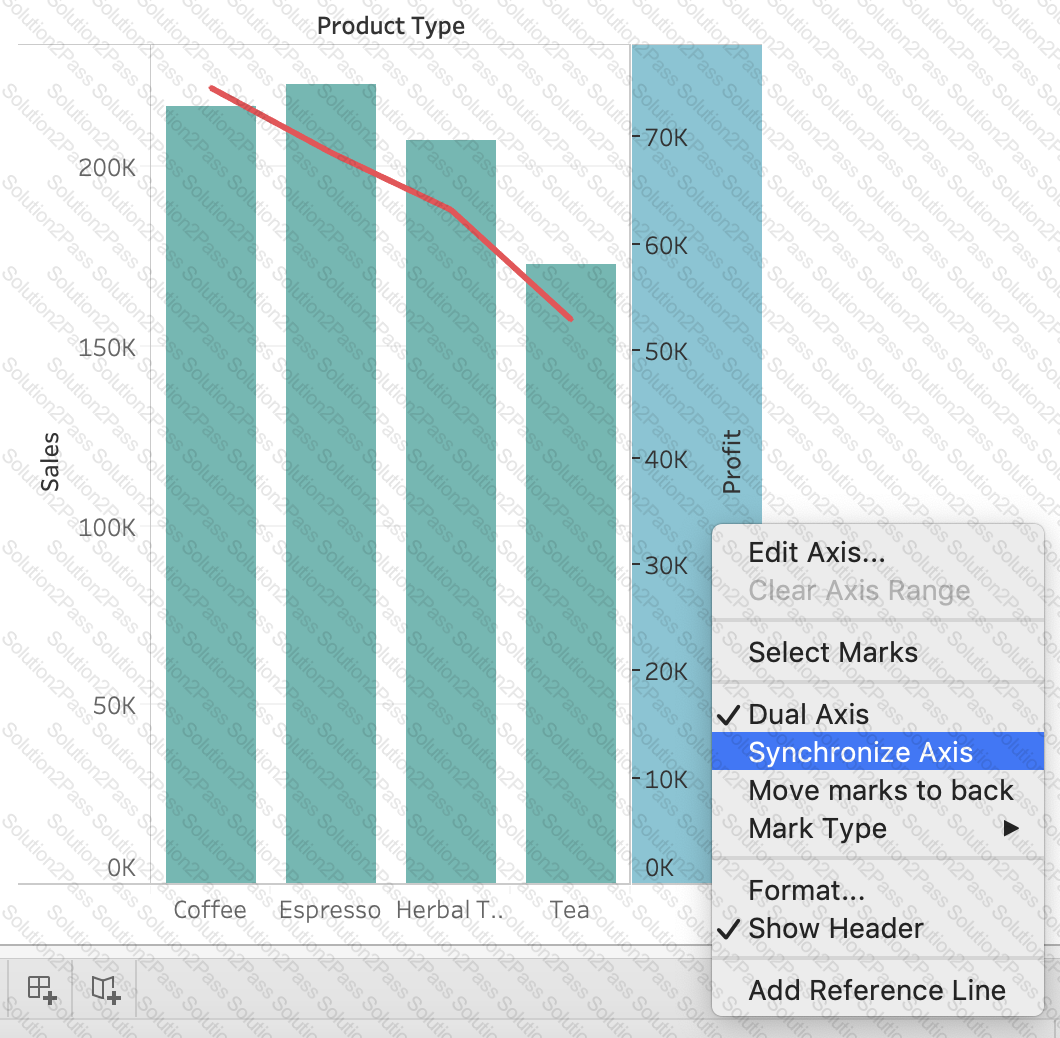
What does the following marker/icon do in Tableau?
 Chart, bar chart
Description automatically generated
Chart, bar chart
Description automatically generated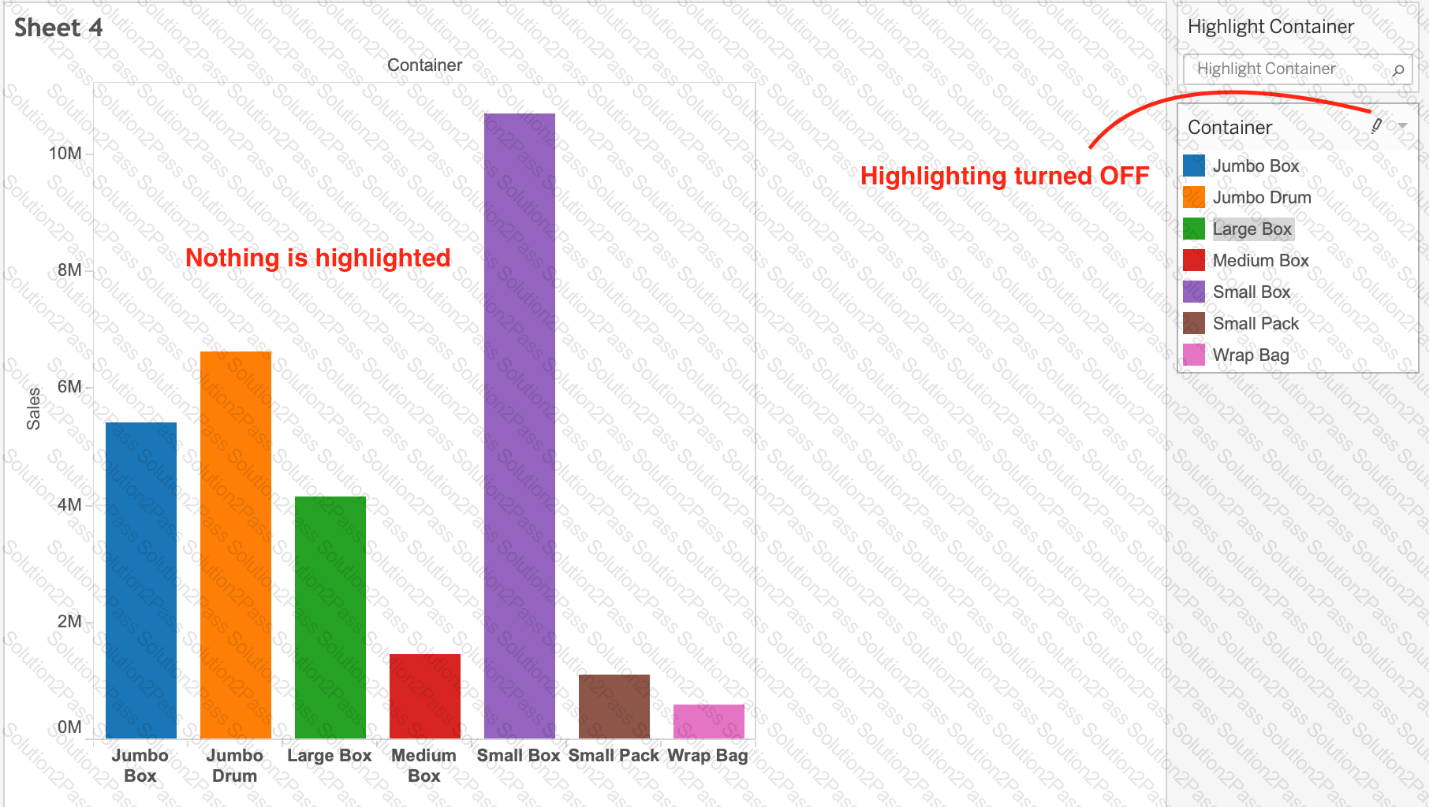 Chart, bar chart
Description automatically generated
Chart, bar chart
Description automatically generatedA dual axis chart is useful for comparing two measures that___________.
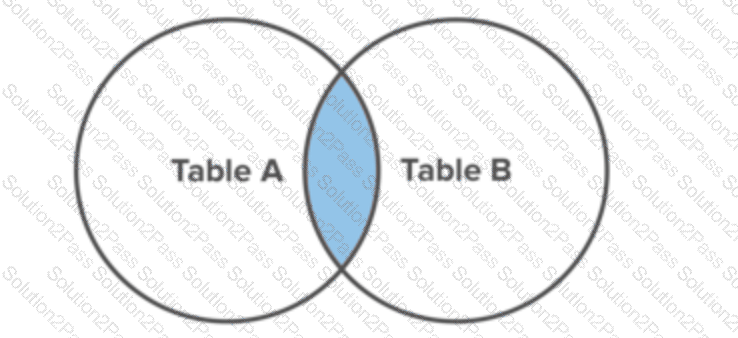
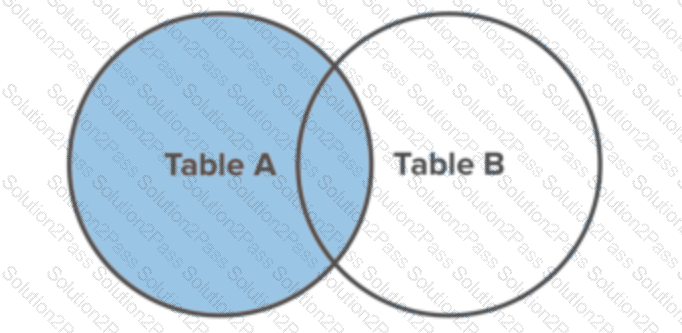
Which of the following situations describe the best reason to use a union?
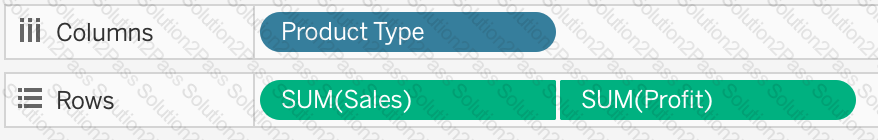
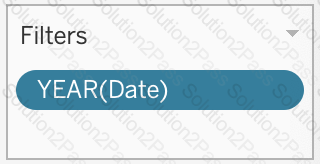
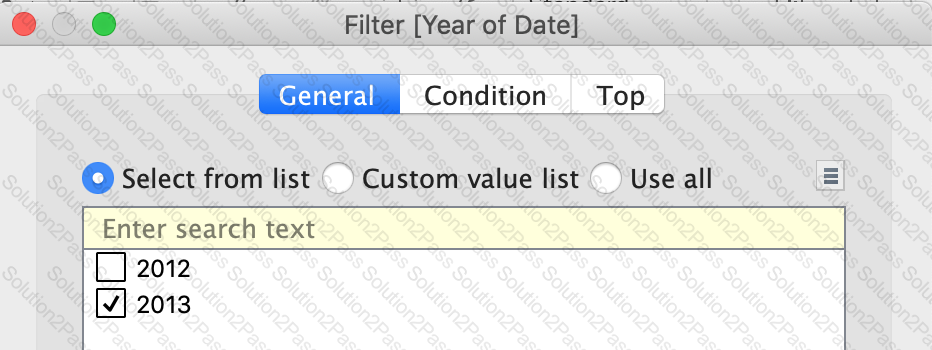
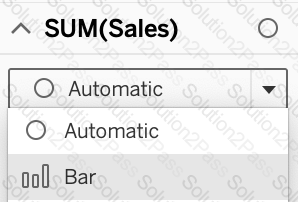
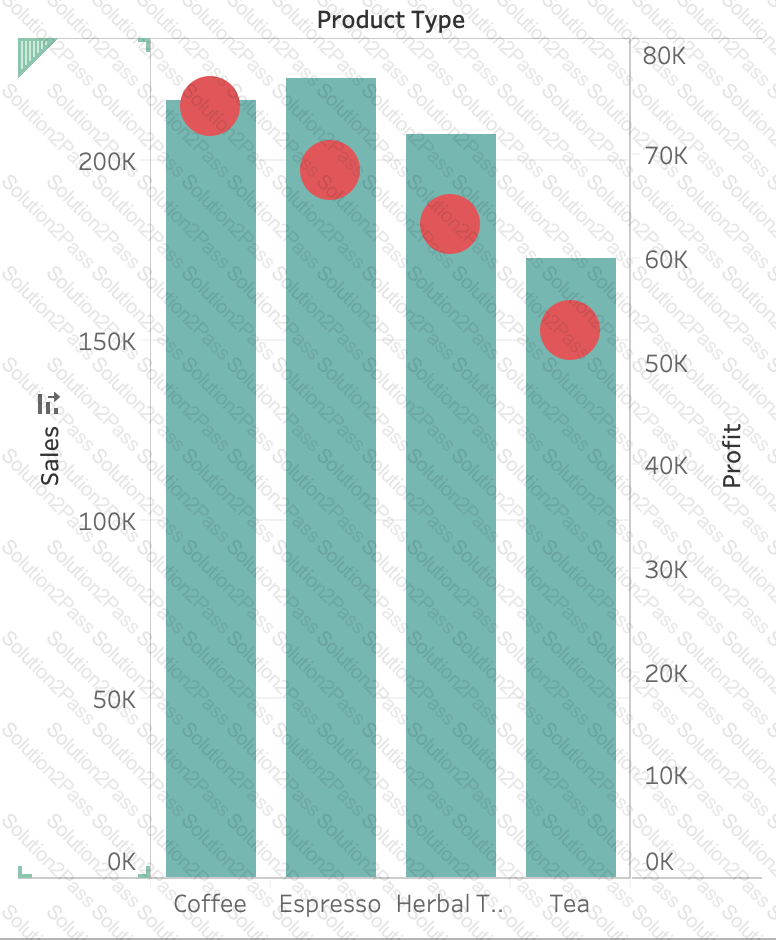
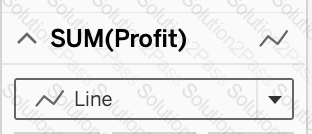
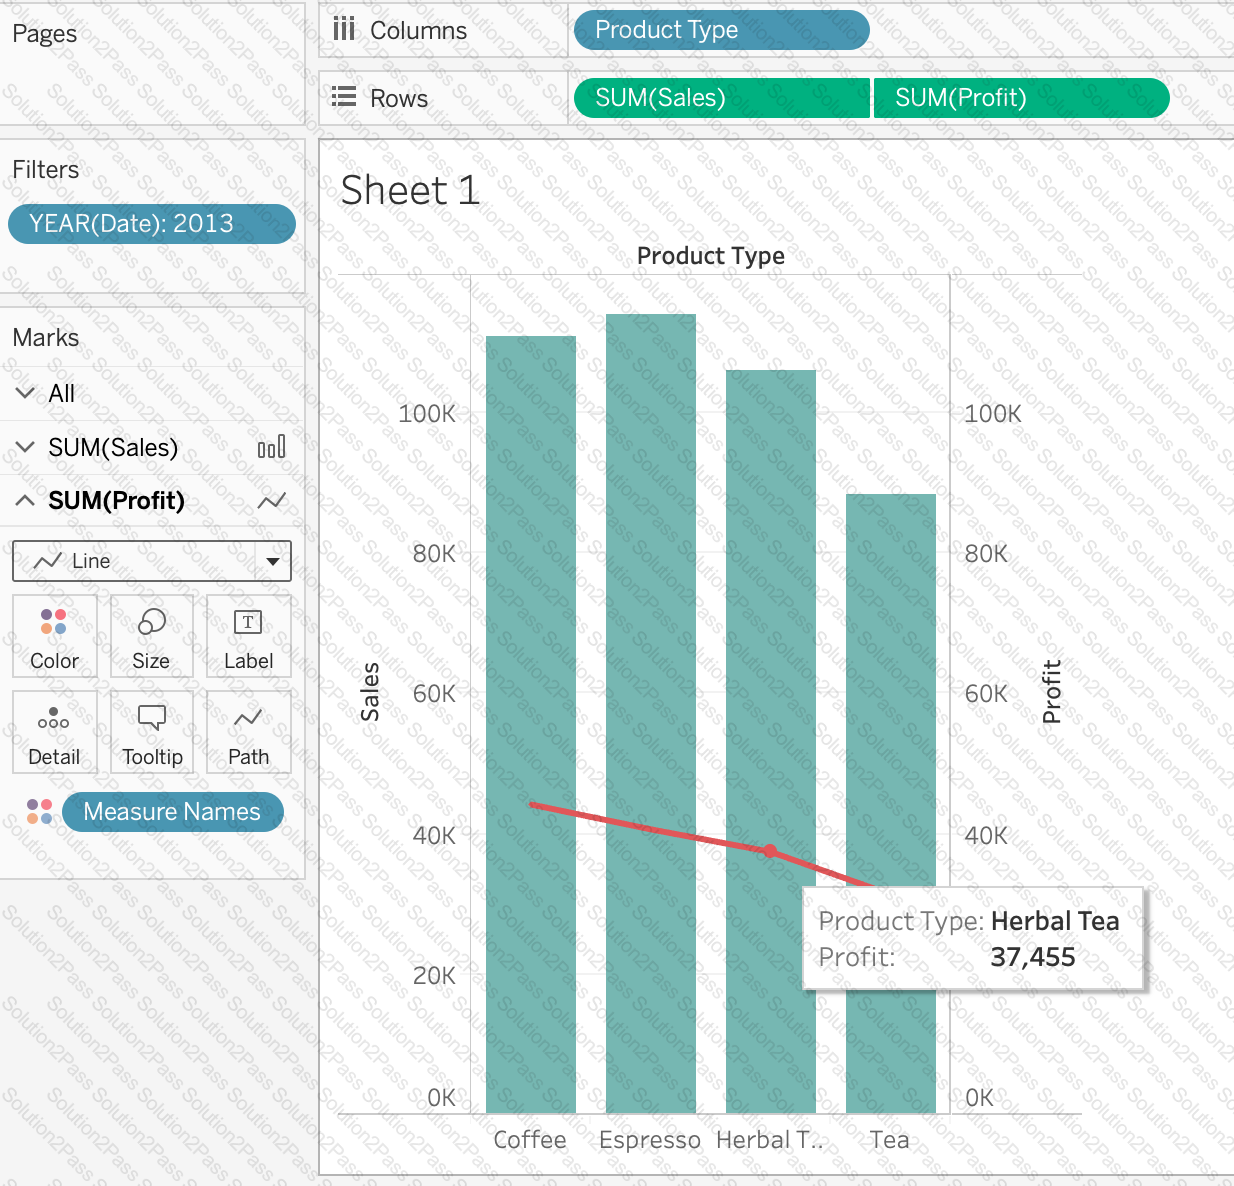
Using the CoffeeChain table, create a Dual Axis chart showing the Sales (Bar chart) and Profit (Line Chart) for each Product type. What was the Profit for the Herbal Tea product type in 2013?
A ________________ is a single zip file that contains a workbook along with any supporting local file data and background images. This format is the best way to package your work for sharing with others who don’t have access to the original data.
By default, what does Tableau do when you connect to a data source?
True or False: Enabling any other type of sort (Field, alphabetic, or Nested) clears the manual sort we create.
A Tableau Support case can be opened in which of the following valid ways?
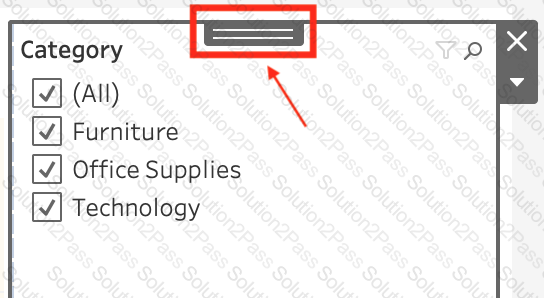
If you have a dashboard and are displaying its filter, how can you rearrange it?
Question 45: Skipped
You have just created a histogram and now want to be able to change the size of bins dynamically. Using which of the following will easily satisfy your requirement?
True or False: A LEFT JOIN or INNER JOIN creates a row each time the join criteria is satisfied, which can result in duplicate rows. One way to avoid this is to use data blending instead.