Desktop-Specialist Tableau Desktop Specialist Exam Free Practice Exam Questions (2026 Updated)
Prepare effectively for your Tableau Desktop-Specialist Tableau Desktop Specialist Exam certification with our extensive collection of free, high-quality practice questions. Each question is designed to mirror the actual exam format and objectives, complete with comprehensive answers and detailed explanations. Our materials are regularly updated for 2026, ensuring you have the most current resources to build confidence and succeed on your first attempt.
Which of the following are compelling reasons to use a Stacked Bar Chart?
True or False: Physical tables remain distinct (normalized), not merged in the data source whereas logical tables are merged into a single, flat table.
With the Marks card drop-down menu set to Automatic, a line chart will be created whenever you place what on the Rows shelf and the Columns shelf?
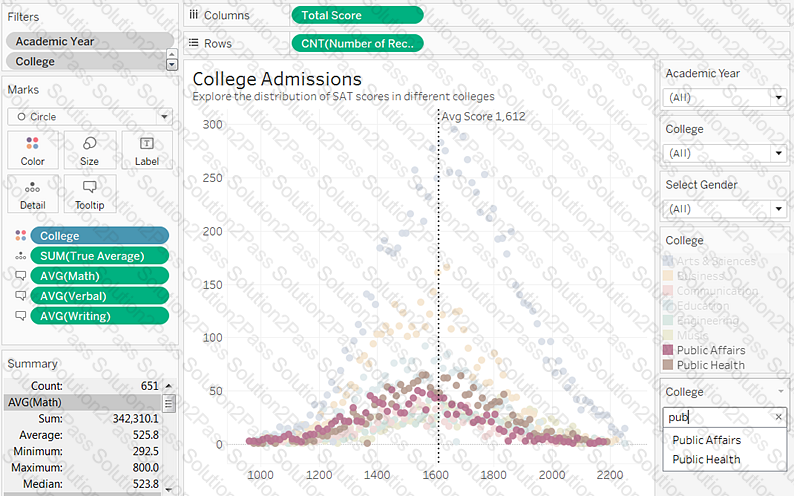
True or False: We can disaggregate the data, to see all of the marks in the view at the most detailed level of granularity
Which statement accurately describes creating a group by selecting headers in a view?
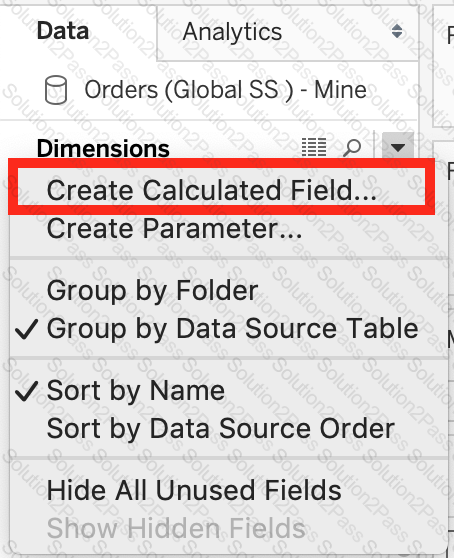
You can use the __________________ in Tableau to clean / organise your data.
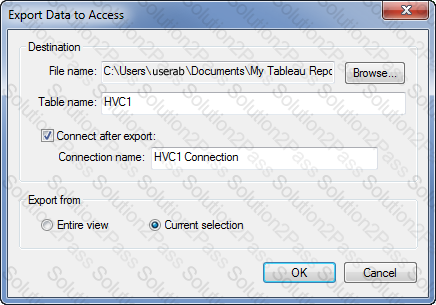
Which of the following are the options to export the data used to build the view / visualisations?
 Graphical user interface, text, application, email
Description automatically generated
Graphical user interface, text, application, email
Description automatically generatedWhat does the box in a box plot represent?
When viewing quick table calculations, such as Percent Difference From, that use a value in the previous column, what will be the first data value in the visualization?
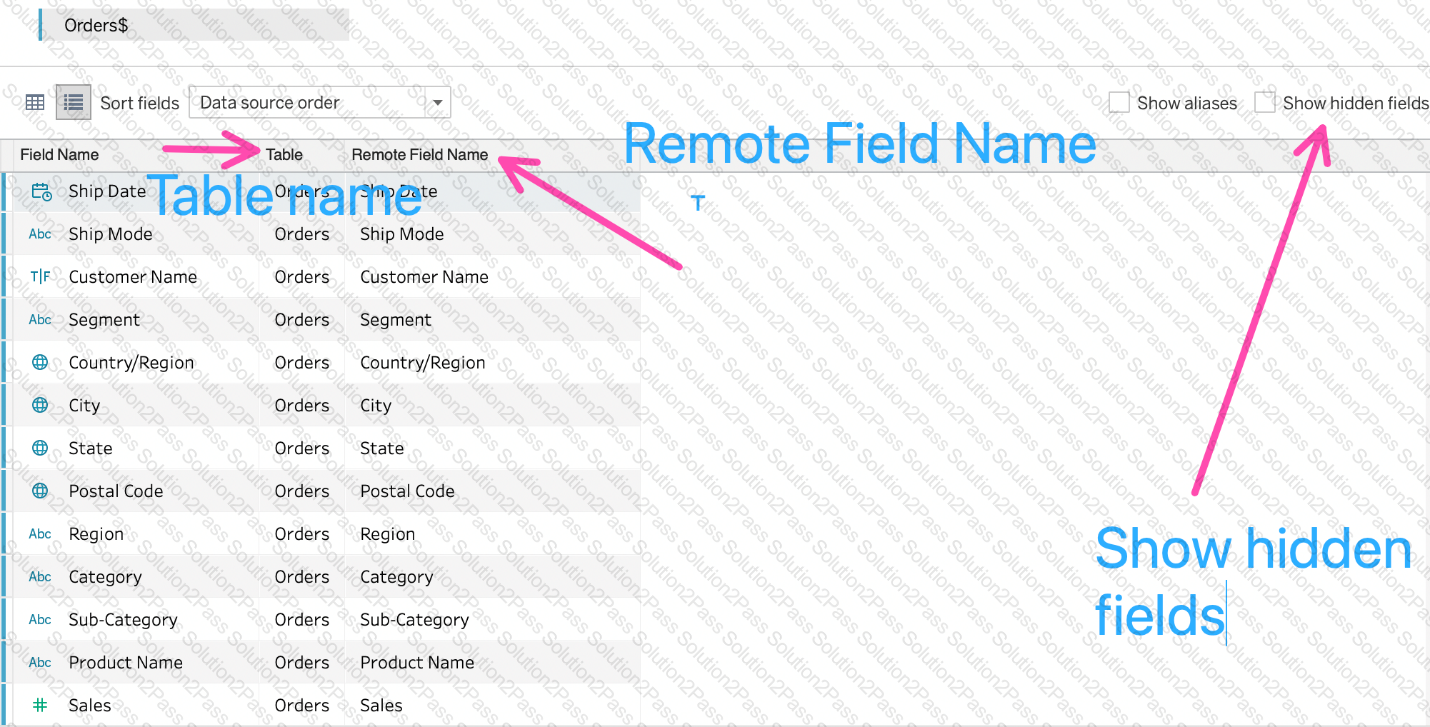
Which of the following are valid use-cases for the 'Manage Metadata' functionality?
 Graphical user interface, text, application, email
Description automatically generated
Graphical user interface, text, application, email
Description automatically generatedIn an extract, what are three differences between a full refresh versus an incremental refresh? Choose three.
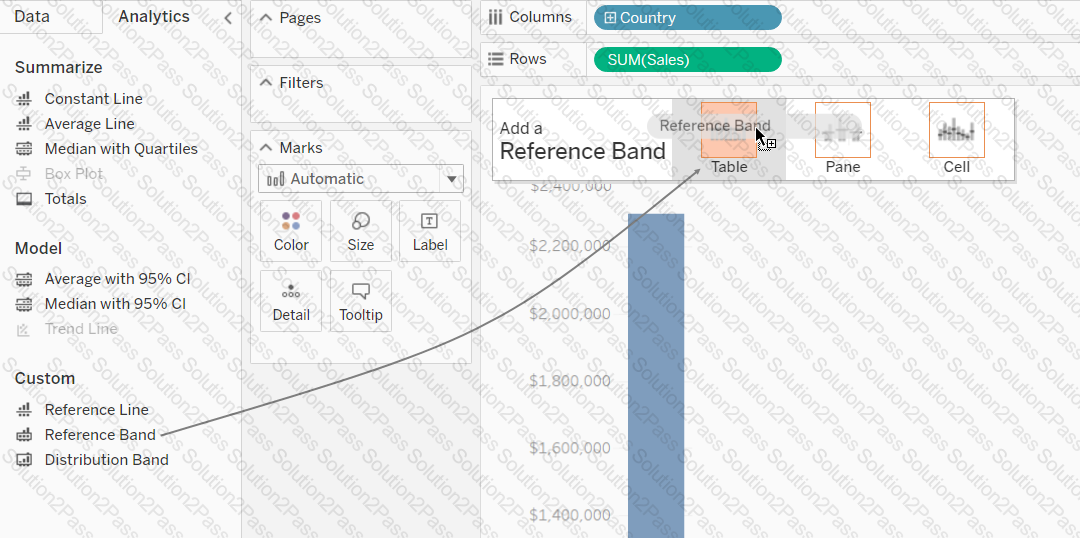
True or False: A reference line cannot be added from the Analytics Pane
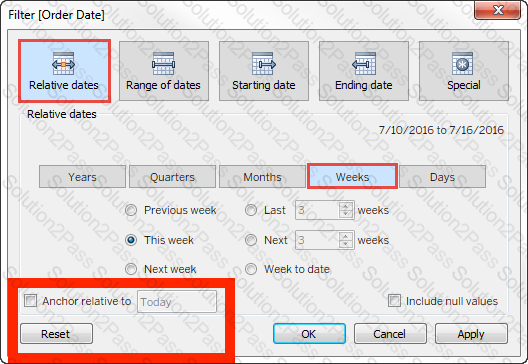
For a relative date filter, the default anchor is _________________
What statement correctly describes a requirement to create a reference line in Tableau?
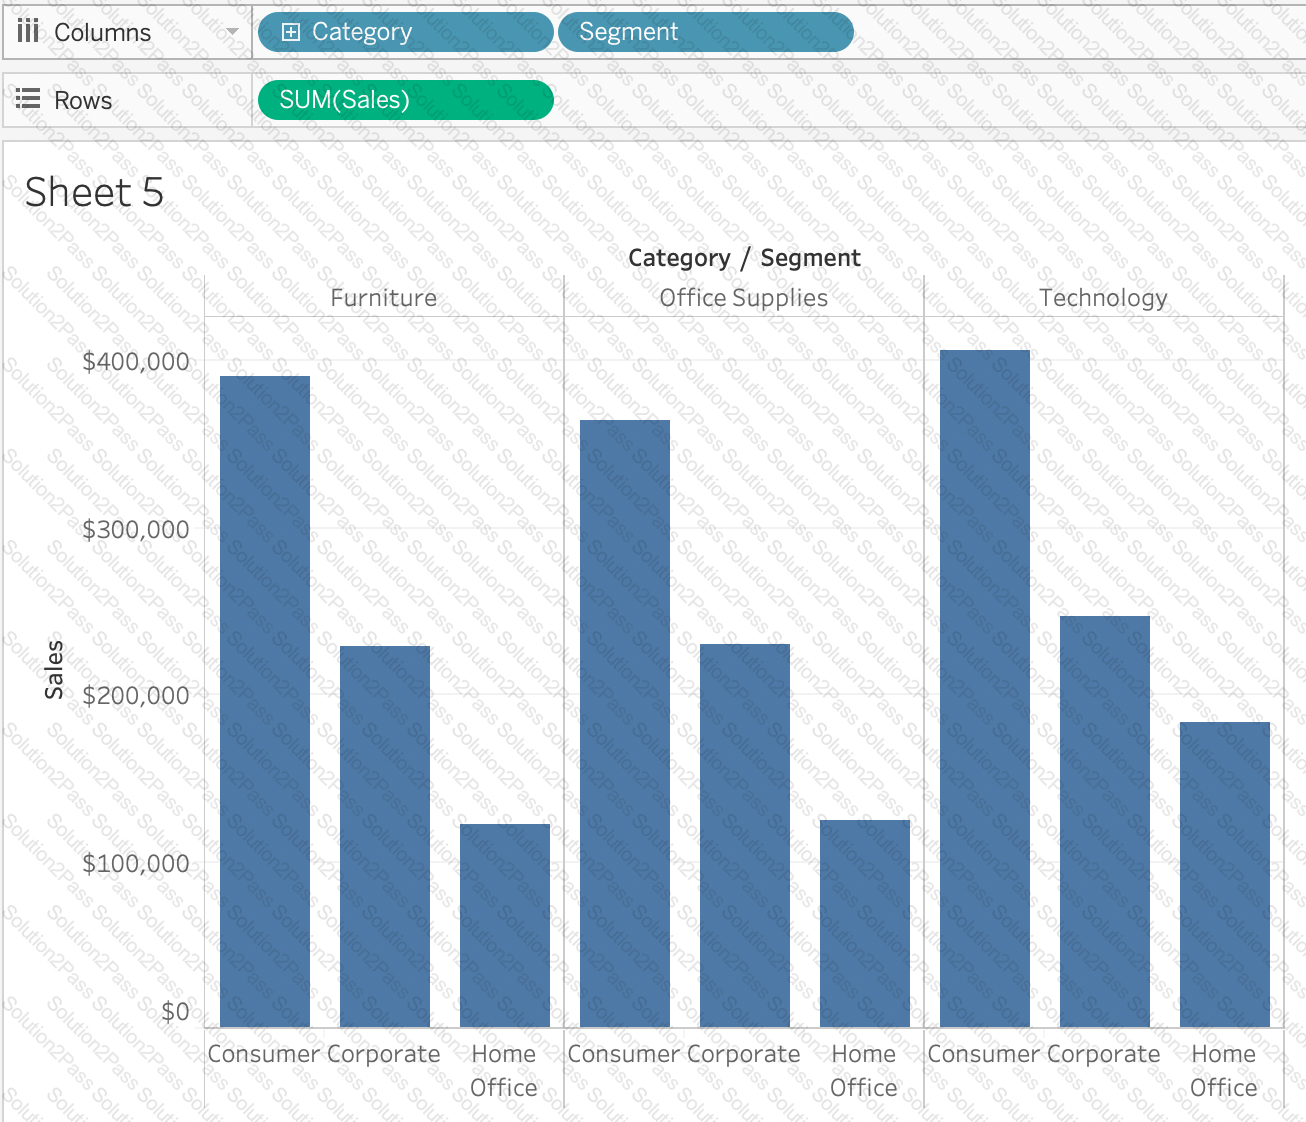
You have a bar chart that has a dimension on the Columns shelf and a measure on the Rows shelf.
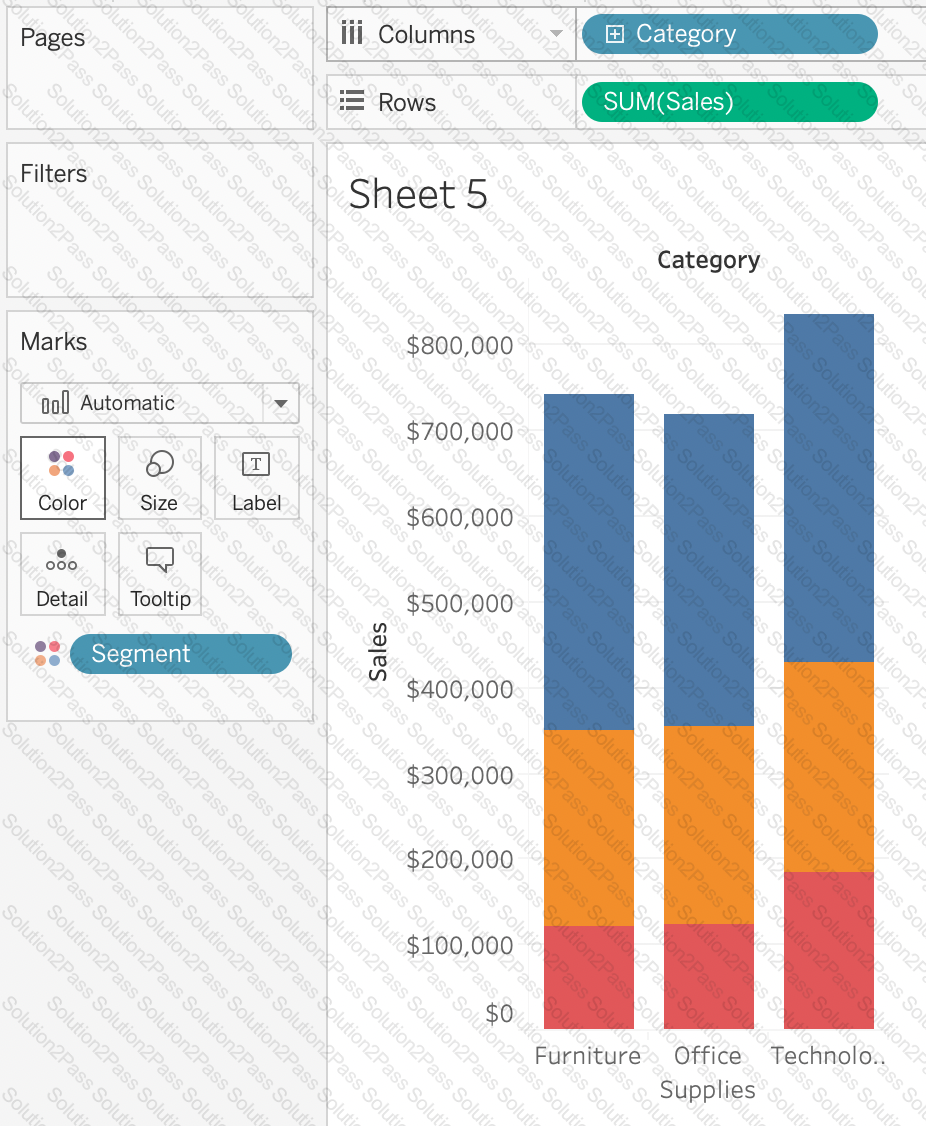
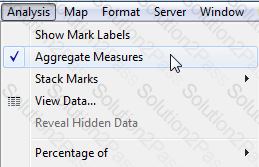
How can you make a stacked bar chart?
Which chart type uses automatically generated sizes that cannot be resized by using the Marks card?
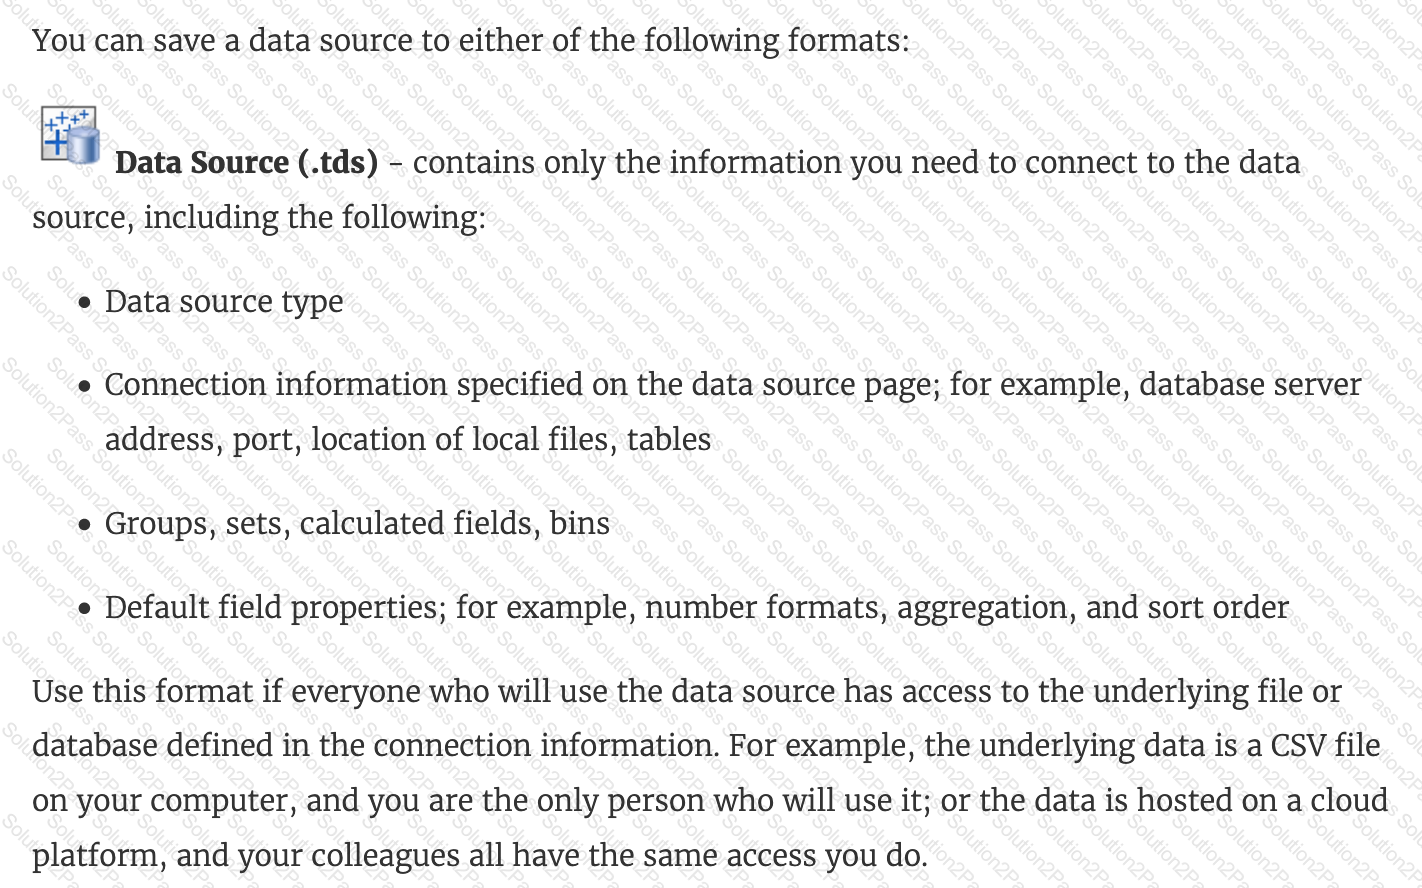
Which of the following are stored in a .tds file? Choose 3.
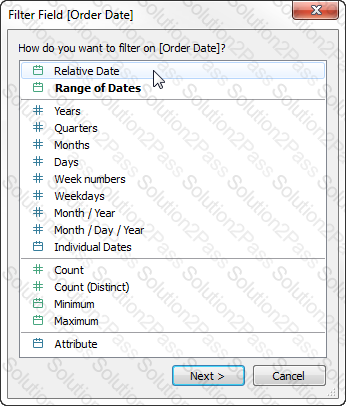
Which type of date filter can you use to choose a range of dates based on TODAY ()?
Which of the following can help us focus on specific data without removing data in the visualization?
 Chart, scatter chart
Description automatically generated
Chart, scatter chart
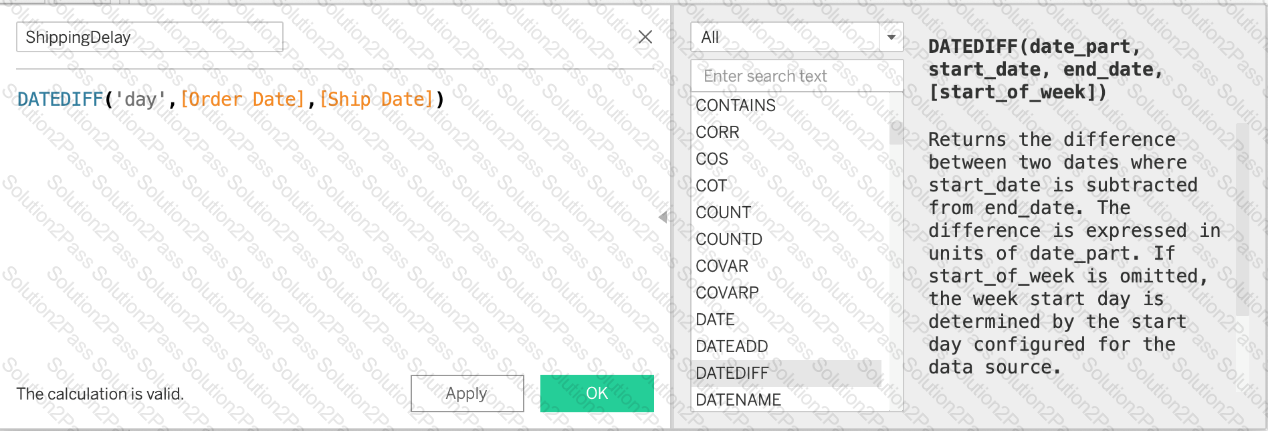
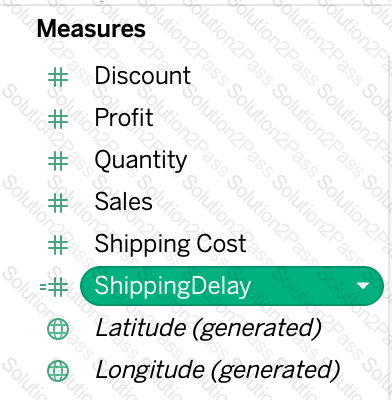
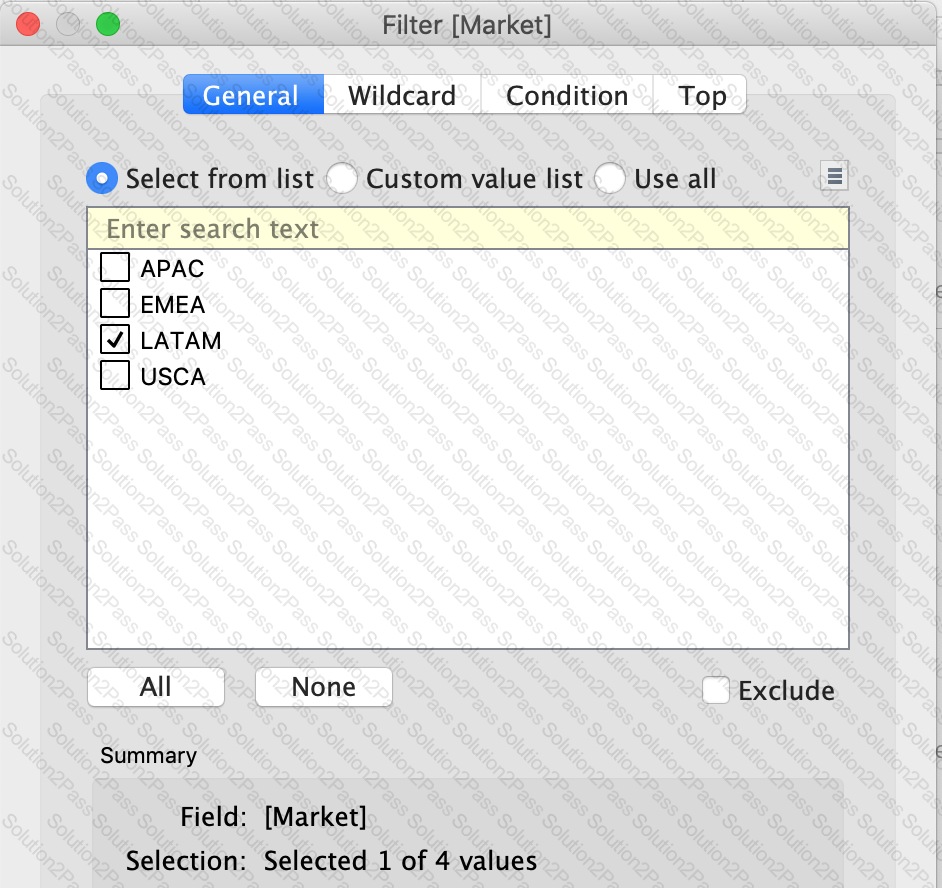
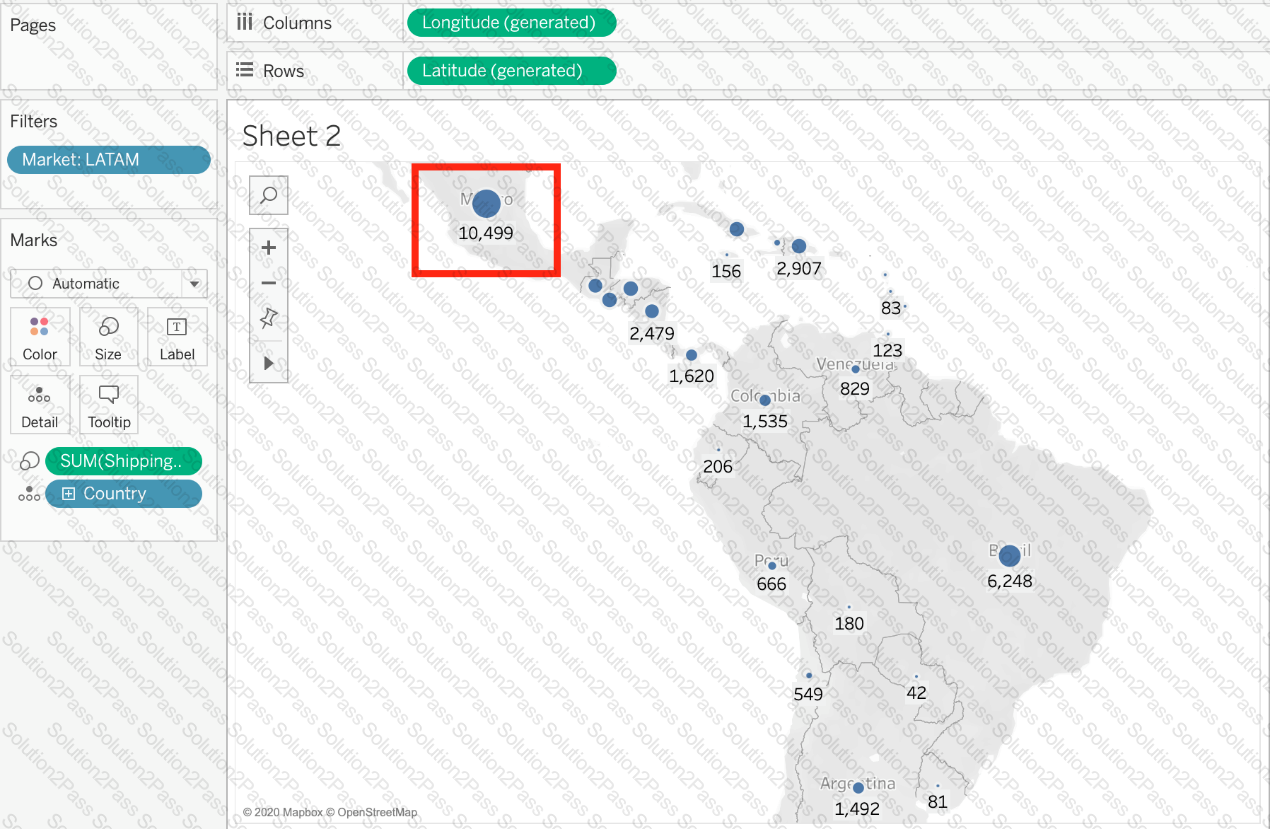
Description automatically generatedUsing the dataset, plot a Map showing all the countries, filtered by Market to only include LATAM. Which country in the LATAM Market has the highest shipping delay (sum of total number of days between the order date and the ship date)?