TDS-C01 Tableau Desktop Specialist Free Practice Exam Questions (2026 Updated)
Prepare effectively for your Tableau TDS-C01 Tableau Desktop Specialist certification with our extensive collection of free, high-quality practice questions. Each question is designed to mirror the actual exam format and objectives, complete with comprehensive answers and detailed explanations. Our materials are regularly updated for 2026, ensuring you have the most current resources to build confidence and succeed on your first attempt.
Which of the following is a good reason for using a bullet graph?
When should you use a relationship instead of a join for two data sets?
Which chart type uses automatically generated sizes that cannot be resized by using the Marks card?
Relationships are represented by __________________ and operate at the ____________________.
Which statement accurately describes a join?
What are two requirements to combine two tables by using a union? Choose two.
Which of the following are valid ways to make the font more readable in Tableau?
True or False: We can disaggregate the data, to see all of the marks in the view at the most detailed level of granularity
A Tableau Support case can be opened in which of the following valid ways?
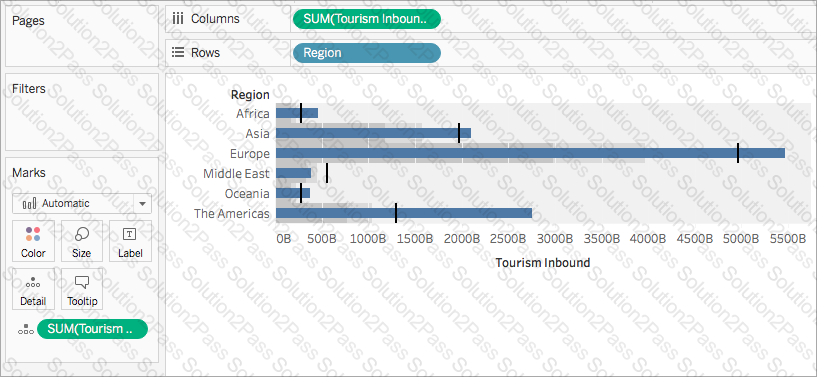
Suppose I have the following view. What will be the total number of marks if I drag a new measure to the row shelf vs the column shelf?
How can you change the default Tableau repository location?
True or False: Context Filters are executed after Data Source filters
Which two types of fields appear blue? Choose two.
Which of the following fields would be best used as Dimensions?
Which of the following would you use to connect to multiple tables in a single data source at once?
What statement correctly describes a requirement to create a reference line in Tableau?
For which of the following charts, does the Size option on the Marks card not work?
Which three statements accurately describes the capabilities of dashboard actions? Choose three.
DOWNLOAD THE DATASET FROM: https://drive.google.com/drive/folders/1WXzqsrNmXVdmQ-574wld4InEplyKT8RP?usp=sharing (if you haven't already)
Using the cwurData table, plot a Map to see which country had the Second highest number of patents in the Year 2013?
What does the box in a box plot represent?
