500-420 Cisco AppDynamics Associate Performance Analyst (CAAPA) Free Practice Exam Questions (2026 Updated)
Prepare effectively for your Cisco 500-420 Cisco AppDynamics Associate Performance Analyst (CAAPA) certification with our extensive collection of free, high-quality practice questions. Each question is designed to mirror the actual exam format and objectives, complete with comprehensive answers and detailed explanations. Our materials are regularly updated for 2026, ensuring you have the most current resources to build confidence and succeed on your first attempt.
Which two roll-up types can be configured for an Information Point? (Choose two.)
When a manual diagnostic session is triggered, what snapshots are captured?
What is a reason for creating an Information Point?
Which item supplements business transaction and transaction analytics data with application data?
Which statement is correct regarding controller-level and tier/node-level dashboards?
On a snapshot flow map, which three metrics indicate why the snapshot might have been taken? (Choose three.)
Under the Troubleshooting menu, which option allows viewing of transaction snapshots?
In the Create Scheduled Report form, which built-in scheduled report type provides the transaction scorecard?
Which built-in scheduled report Includes load, response time, and error graphs?
Which permission allows snapshot archiving?
The performance impact on the_______would lead a Performance Analyst to limit the duration and frequency of automatic diagnostic sessions.
When should URI Segments be used in Transaction Detection rules?
An E-commerce application is built using microservices architecture design with several components. In AppDynamics, how should the Transaction Detection rules be grouped logically?
Within the Application Dashboard, which two methods could a Performance Analyst use to quickly demonstrate that a slow backend is contributing to an application slowdown? (Choose two.)
Which tab within the Application Dashboard displays performance trends for each of Snapshots, Average Response Time, and Events within one central view?
A Performance Analyst has opened a database collector view. Which tab should be clicked on next to find slow queries?
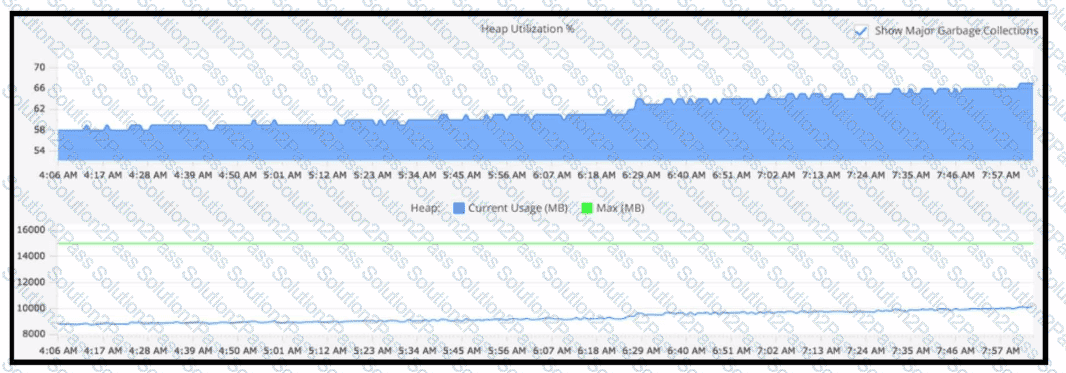
Refer to the exhibit. Using this heap utilization graph, which method is used to confirm if a memory leak is occurring during a certain time frame?