ICBB IASSC Lean Six Sigma – Black Belt Free Practice Exam Questions (2026 Updated)
Prepare effectively for your IASSC ICBB IASSC Lean Six Sigma – Black Belt certification with our extensive collection of free, high-quality practice questions. Each question is designed to mirror the actual exam format and objectives, complete with comprehensive answers and detailed explanations. Our materials are regularly updated for 2026, ensuring you have the most current resources to build confidence and succeed on your first attempt.
Kanban establishes a means of monitoring production, conveyance and delivery information such that efficient flow is established. The method used by Kanban is to require a _________ before anything moves.
A Belt working in a supply chain environment has to make a decision to change suppliers of critical raw materials for a new product upgrade. The purchasing manager is depending on the Belt’s effort requiring that the average cost of an internal critical raw material component be less than or equal to $2,800 in order to stay within budget. Using a sample of 55 first article components, a Mean of the new product upgrade price of $2,240 and a Standard Deviation of $120 was estimated. Based on the data provided, the Z value for the data assuming a Normal Distribution is?
Which of these might contribute to similar distributions having Unequal Variance?
An ANOVA used across many dependent variables could increase the Beta risk.
The Control Limits width varies if the sample size varies for which type of chart?
Much of the Six Sigma methodology is used to identify and remove causes for _____________ .
The Waste of Overproduction is defined as ______________________.
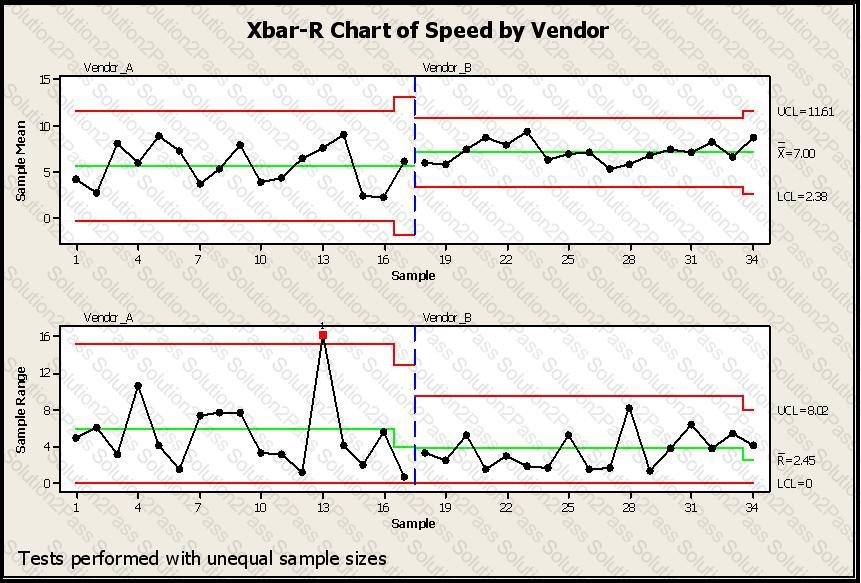
SPC Charts are used extensively in different business and decision-making environments. In this example a vendor is being selected based on speed of delivery. Which of the conclusions would help you pick a vendor for your needs regarding lead-time of delivery from your vendors? (Note: There are 4 correct answers).
A Full Factorial experiment using a 3 level 3 factor approach has been proposed to test the viability of an extrusion machine experiment. How many treatment combinations will this approach involve?
In a good Measurement System the most variation will be with part-to-part measurements. What should you do if the majority of variation is associated with the Gage R&R assuming the gage is technically capable?
What aspects of Measurement Systems Analysis (MSA) studies are applicable when the process used to measure does not damage the part?
A statistical test or Hypothesis Test is performed to reject or fail to reject a stated hypothesis and it converts the Practical Problem into a Statistical Problem.
The Mann-Whitney test is a powerful test and is unique to situations from which of the choices listed? (Note: There are 2 correct answers).
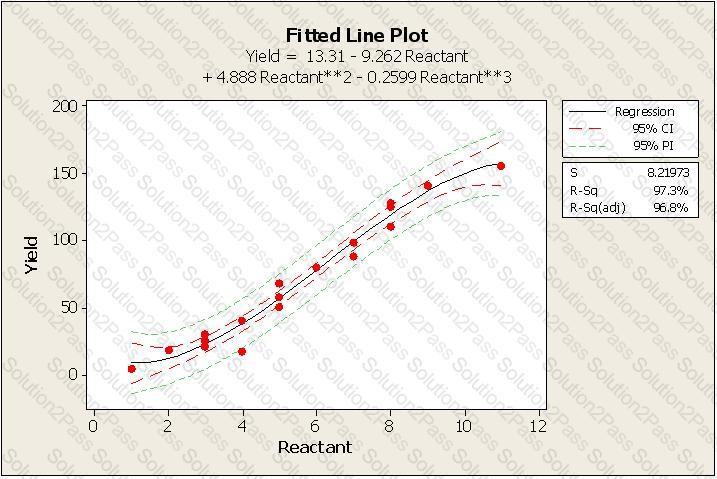
Which statement is NOT correct about the Fitted Line Plot shown here?
A valuable tool to use during the Measure Phase to show material and information flow throughout an entire process is the ______________ .
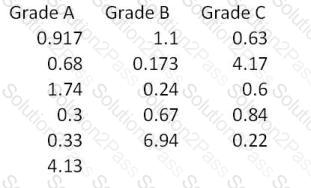
For the data shown here which statement(s) are true? (Note: There are 2 correct answers).
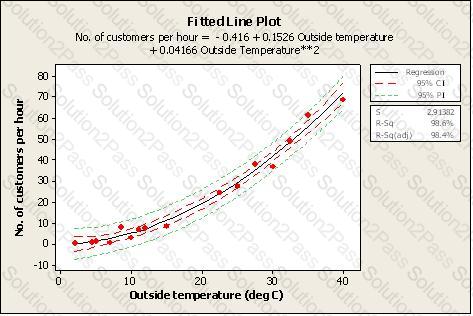
Which statement(s) are correct about the Regression shown here? (Note: There are 2 correct answers).
Following the completion of a LSS project the Belt not only creates a Control Plan he also develops a _____________ so those involved in the process know what to do when the critical metrics move out of spec.
A Belt is analyzing data and upon creation of the graphical analysis sees multiple modes. One of the primary reasons this could occur is because the process has experienced a ____________________.
The Lean toolbox includes all of the following items except __________.
