PL-300 Microsoft Power BI Data Analyst Free Practice Exam Questions (2026 Updated)
Prepare effectively for your Microsoft PL-300 Microsoft Power BI Data Analyst certification with our extensive collection of free, high-quality practice questions. Each question is designed to mirror the actual exam format and objectives, complete with comprehensive answers and detailed explanations. Our materials are regularly updated for 2026, ensuring you have the most current resources to build confidence and succeed on your first attempt.
You have a semantic model named Model1.
You need to ensure that users can verify that the data in Model1 meets corporate standards. What should you do?
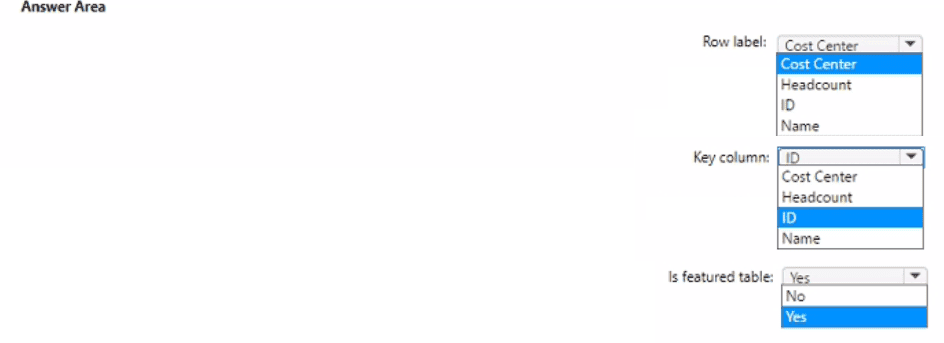
You create a Power Bl dataset that contains the table shown in the following exhibit.
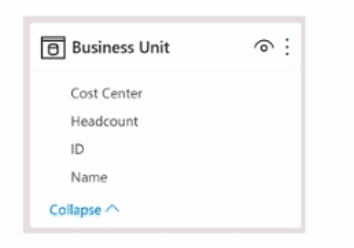
You need to make the table available as an organizational data type In Microsoft Excel.
How should you configure the properties of the table? To answer select the appropriate options in the answer area.
NOTE: Each correct selection is worth one point.

Note: This question is part of a series of questions that present the same scenario. Each question in the series contains a unique solution that might meet the stated goals. Some question sets might have more than one correct solution, while others might not have a correct solution.
After you answer a question in this scenario, you will NOT be able to return to it. As a result, these questions will not appear in the review screen.
You have a clustered bar chart that contains a measure named Salary as the value and a field named Employee as the axis. Salary is present in the data as numerical amount representing US dollars.
You need to create a reference line to show which employees are above the median salary.
Solution: You create an average line by using the Salary measure.
Does this meet the goal?
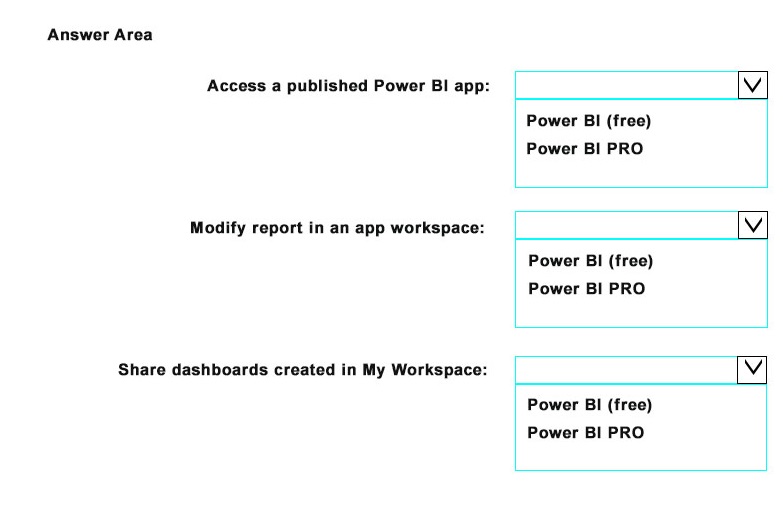
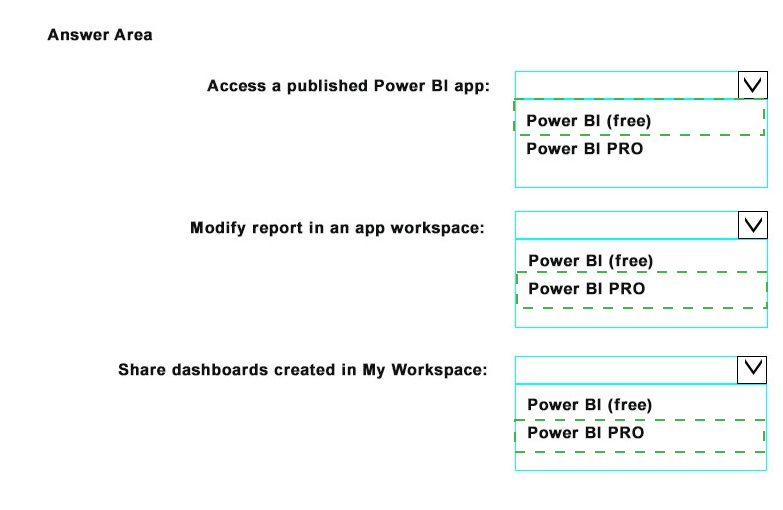
Your company plans to use Power BI for 20 users in the sales department. The users will perform the following tasks:
Access a published Power BI app
Modify reports in an app workspace
Share dashboards created in My Workspace
You need to identify which Power BI licenses are required for the tasks. The solution must use the Power BI (free) licenses, whenever possible.
Which license should you identify for each task? To answer, select the appropriate options in the answer area.
NOTE: Each correct selection is worth one point.
You have a Fabric tenant that hosts the semantic models shown in the following table.
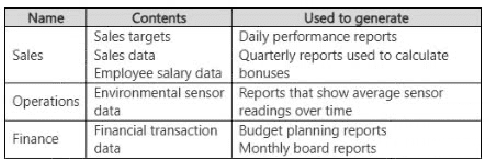
You have the following requirements:
The export of reports that contain Personally Identifiable Information (PII) must be prevented.
Data used for financial decisions must be reviewed and approved before use.
For each of the following statements, select Yes if the statement is true. Otherwise, select No.
NOTE: Each correct selection is worth one point.


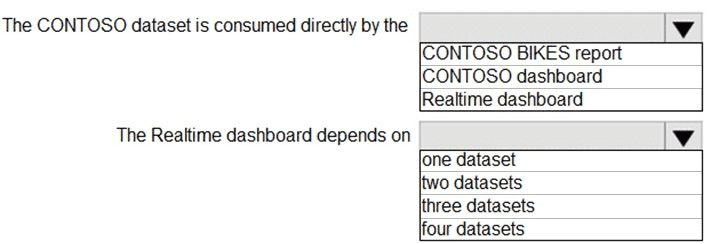
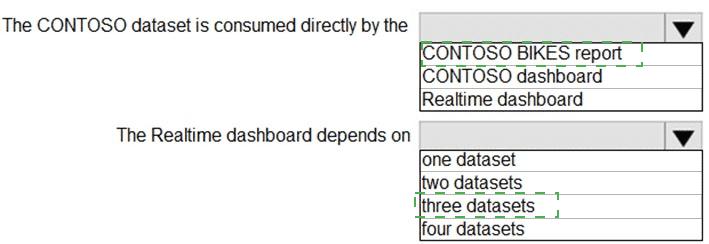
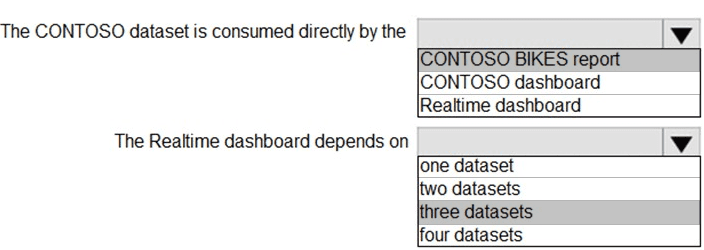
You have the data lineage shown in the following exhibit.
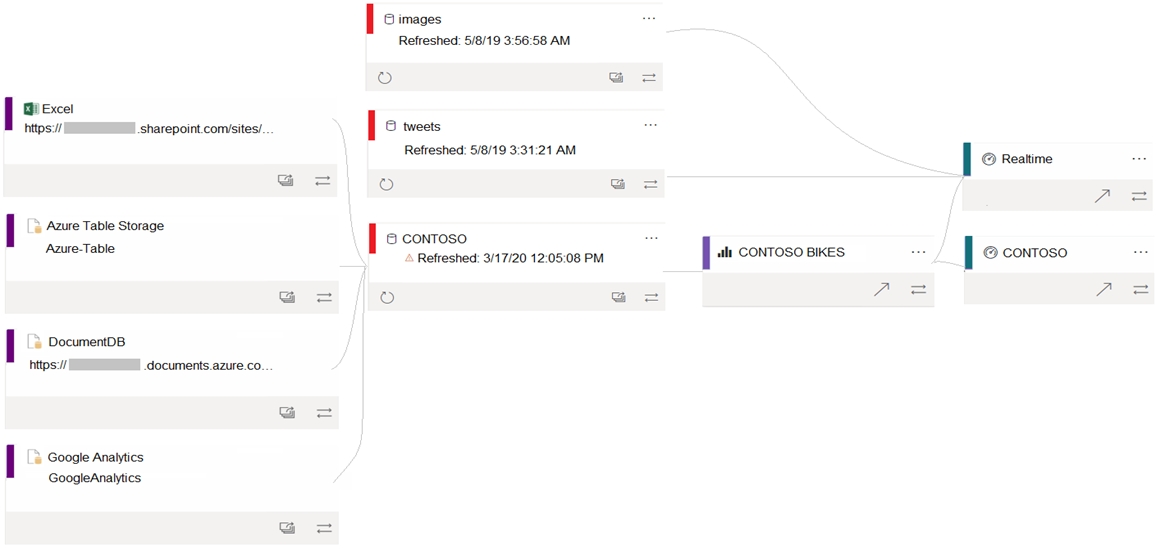
Use the drop-down menus to select the answer choice that completes each statement based on the information presented in the graphic.
NOTE: Each correct selection is worth one point.
You need to create a visual that enables the adhoc exploration of data as shown in the following exhibit.
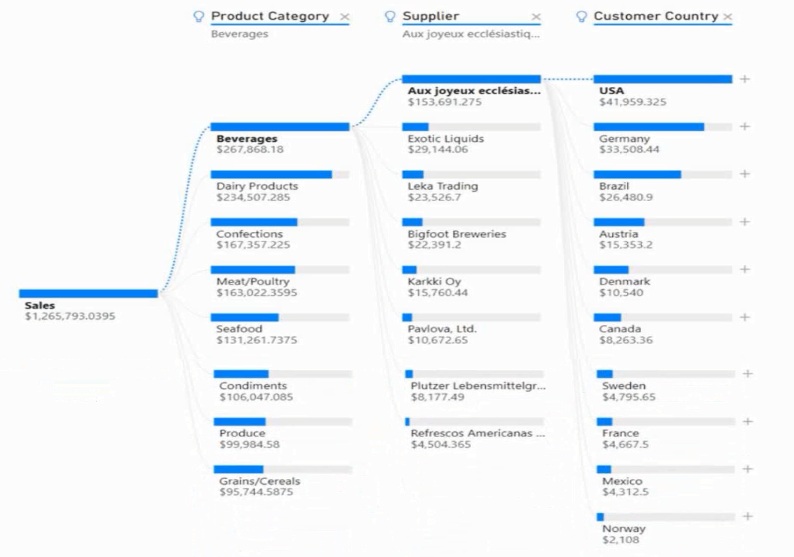
Which type of visual should you use?
For the sales department at your company, you publish a Power Bl report and a semantic model that imports data from a Microsoft Excel file located in a Microsoft SharePoint folder. The semantic model contains several measures.
You need to create a new Power Bl report from the existing data that will use many of the measures created in the initial Power Bl semantic model. The solution must minimize development effort.
Which type of data source should you use?
In Power Bi Desktop, you are creating visualizations in a report based on an imported dataset
You need to allow Power Bi users to export the summarized data used to create the visualizations but prevent the users from exporting the underlying data
What should you do?
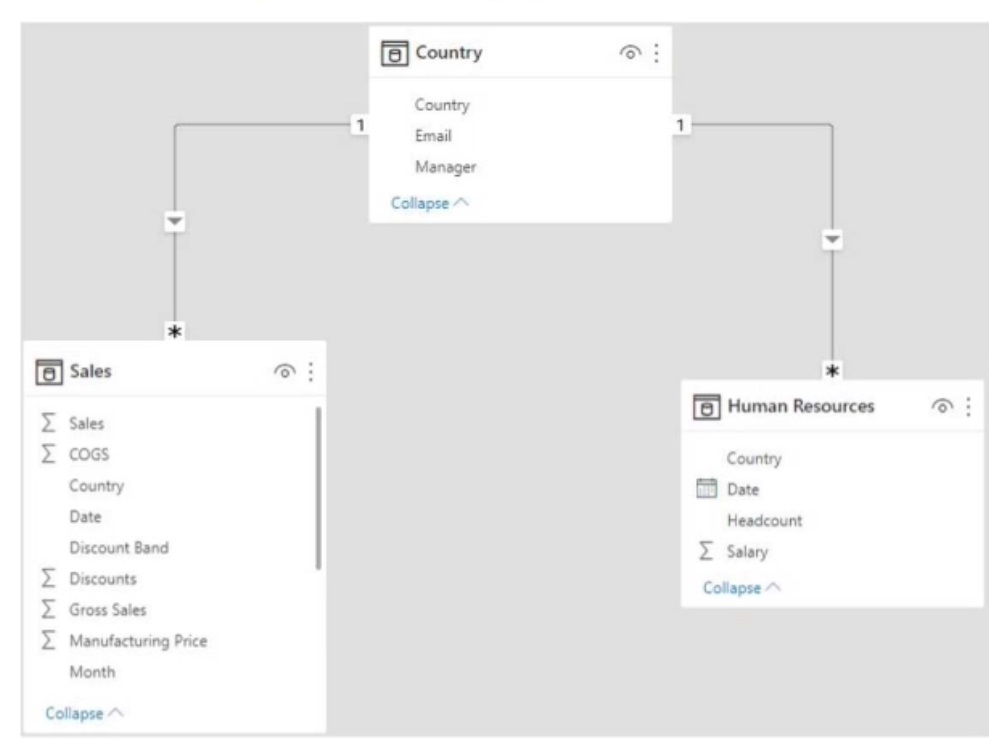
You have the Power Bl data model shown in the following exhibit.
You create two row-level security (RlS) roles named Manager and CFO.
You plan to publish the dataset to the Power Bl service.
You need to create DAX expressions for the RLS filters. The solution must meet the following requirements:
• Each manager must see only the data in the Sales and Human Resources tables for their own country.
• The CFO must be prevented from seeing the data in the Human Resources table.
• The CFO must see the sales data of all countries.
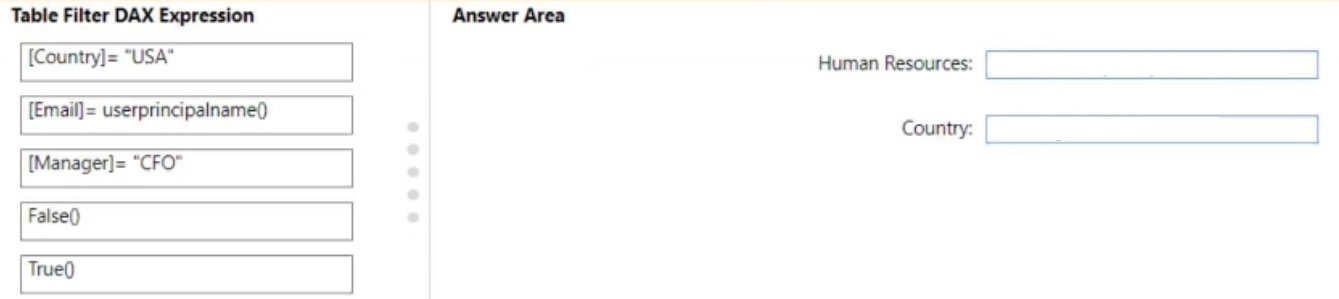
How should you complete the DAX expressions to meet the requirements? To answer, drag the appropriate expressions to the correct targets. Each expression may be used once, more than once, or not at all. You may need to drag the split bar between panes or scroll to view content.
NOTE: Each correct selection is worth one point.
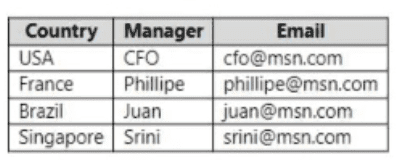
The Country table contains the following data.
You plan to publish the dataset to the Power Bl service.
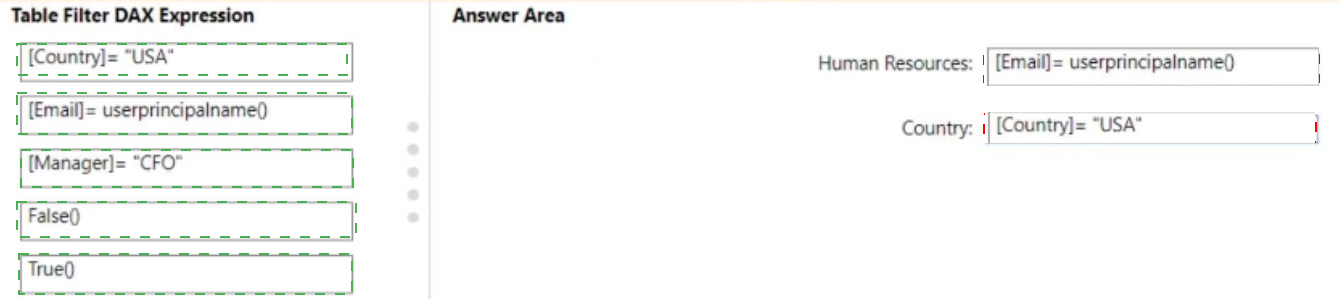
You need to create DAX expressions for the RLS filters. The solution must meet the following requirements:
• Each manager must see only the data in the Sales and Human Resources tables for their own country.
• The CFO must be prevented from seeing the data in the Human Resources table.
• The CFO must see the sales data of all countries.
How should you complete the DAX expressions to meet the requirements? To answer, drag the appropriate expressions to the correct targets. Each expression may be used once, more than once, or not at all. You may need to drag the split bar between panes or scroll to view content.
NOTE: Each correct selection is worth one point.
Note: This question is part of a series of questions that present the same scenario. Each question in the series contains a unique solution that might meet the stated goals. Some question sets might have more than one correct solution, while others might not have a correct solution.
After you answer a question in this section, you will NOT be able to return to it. As a result, these questions will not appear in the review screen.
You have a Microsoft Excel workbook that is saved to Microsoft SharePoint Online. The workbook contains several Power View sheets.
You need to recreate the Power View sheets as reports in the Power Bl service.
Solution: From the Power Bl service, get the data from SharePoint Online, and then click Connect
Does this meet the goal?
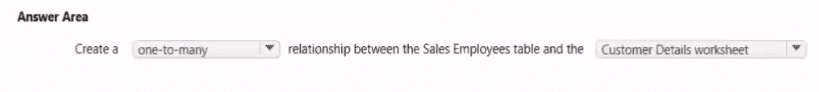
You need to create a relationship in the dataset for RLS.
What should you do? To answer select the appropriate options in the answer area.
NOTE: Each correct selection is worth one point.

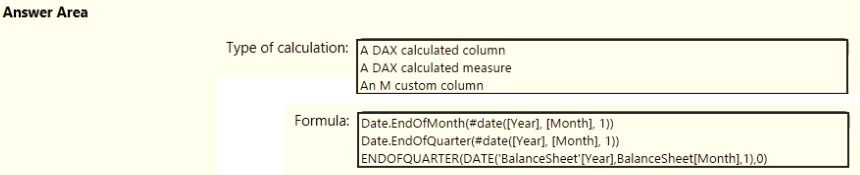
Which DAX expression should you use to get the ending balances in the balance sheet reports?
You plan to generate a line chart to visualize and compare the last six You need to Increase the accessibility of the visual. What should you do? O A- A. Configure a unique marker for each series
B. Configure a distinct color for each series.
C. Replace long text with abbreviation and acronyms.
D. Move important Information to a tooltip.
You have a Microsoft Power BI report. The size of PBIX file is 550 MB. The report is accessed by using an App workspace in shared capacity of powerbi.com.
The report uses an imported dataset that contains one fact table. The fact table contains 12 million rows. The dataset is scheduled to refresh twice a day at 08:00 and 17:00.
The report is a single page that contains 15 AppSource visuals and 10 default visuals.
Users say that the report is slow to load the visuals when they access and interact with the report.
You need to recommend a solution to improve the performance of the report.
What should you recommend?
You build a Power Bi report that displays loT temperature data streaming from a refrigerator.
You publish the report to the Power BI service.
You need to be notified when the temperature rises above four degrees Celsius.
What should you do?
You need to ensure that the data is updated to meet the report requirements. The solution must minimize configuration effort.
What should you do?
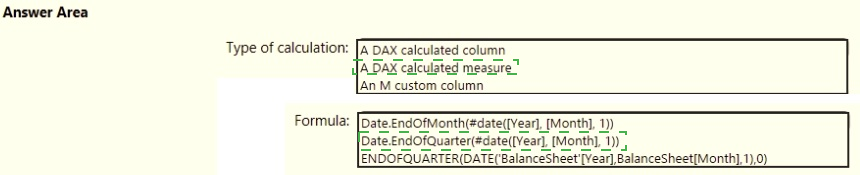
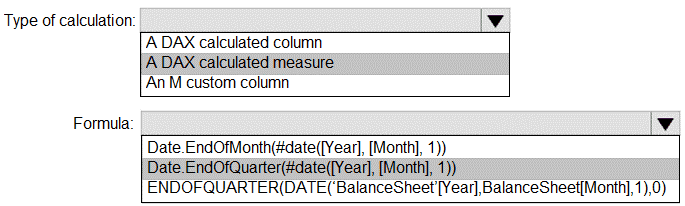
You need to calculate the last day of the month in the balance sheet data to ensure that you can relate the balance sheet data to the Date table. Which type of calculation and which formula should you use? To answer, select the appropriate options in the answer area. NOTE: Each correct selection is worth one point.
You need to create the relationship between the product list and the revenue results. The solution must minimize the time it takes to render visuals.
What should you set as the relationship cardinality?
You need to recommend a strategy to consistently define the business unit, department, and product category data and make the data usable across reports.
What should you recommend?
