PL-300 Microsoft Power BI Data Analyst Free Practice Exam Questions (2026 Updated)
Prepare effectively for your Microsoft PL-300 Microsoft Power BI Data Analyst certification with our extensive collection of free, high-quality practice questions. Each question is designed to mirror the actual exam format and objectives, complete with comprehensive answers and detailed explanations. Our materials are regularly updated for 2026, ensuring you have the most current resources to build confidence and succeed on your first attempt.
Note: This question is part of a series of questions that present the same scenario. Each question in the series contains a unique solution that might meet the stated goals. Some question sets might have more than one correct solution, while others might not have a correct solution.
After you answer a question in this section, you will NOT be able to return to it. As a result, these questions will not appear in the review screen.
You have a Power BI model that contains two tables named Sales and Date. Sales contains four columns named TotalCost, DueDate, ShipDate, and OrderDate. Date contains one column named Date.
The tables have the following relationships:
Sales[DueDate] and Date[Date]
Sales[ShipDate] and Date[Date]
Sales[OrderDate] and Date[Date]
The active relationship is on Sales[DueDate].
You need to create measures to count the number of orders by [ShipDate] and the orders by [OrderDate]. You must meet the goal without duplicating data or loading additional data.
Solution: You create measures that use the CALCULATE, COUNT, and USERELATIONSHIP DAX functions.
Does this meet the goal?
You have a collection of reports for the HR department of your company.
You need to create a visualization for the HR department that shows historical employee counts and predicts trends during the next six months.
Which type of visualization should you use?
You are creating a report in Power BI Desktop.
You load a data extract that includes a free text field named coll.
You need to analyze the frequency distribution of the string lengths in col1. The solution must not affect the size of the model.
What should you do?
You have a Power BI report.
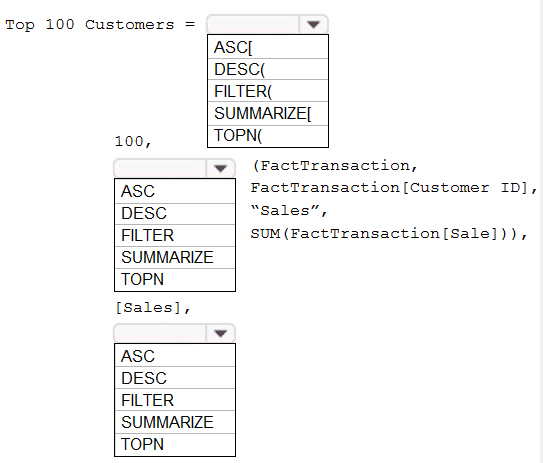
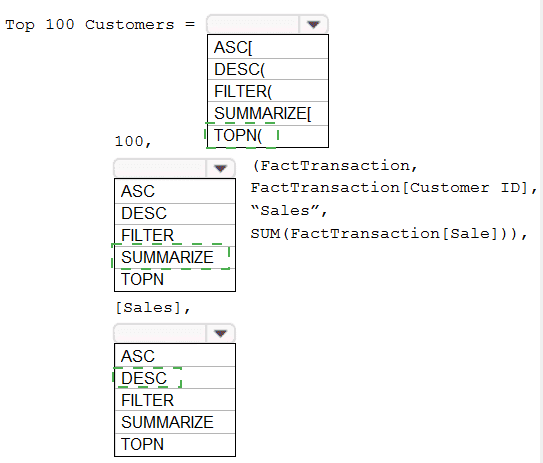
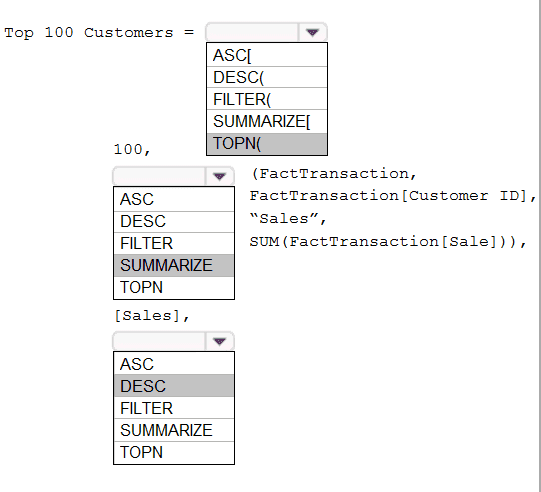
You need to create a calculated table to return the 100 highest spending customers.
How should you complete the DAX expression? To answer, select the appropriate options in the answer area.
NOTE: Each correct selection is worth one point.
You have the following table named Location.
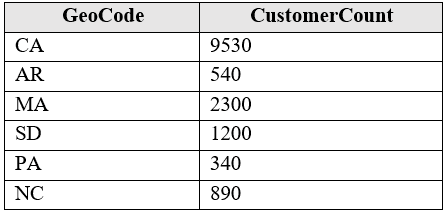
The GeoCode column represents the country where each customer is located.
You create a map visualization as shown in the exhibit. (Click the Exhibit tab.)
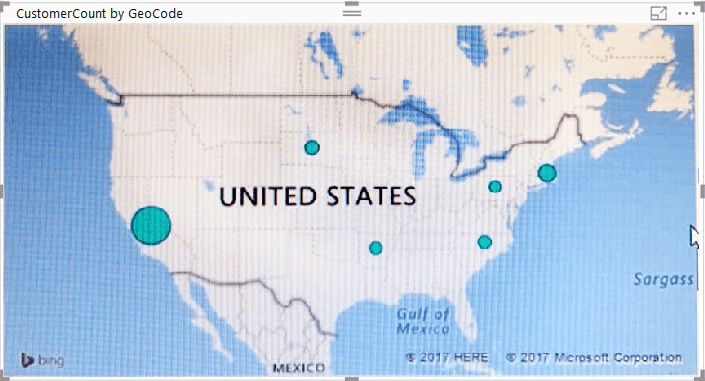
You need to ensure that the map displays the country locations.
What should you do?
What should you do to address the existing environment data concerns?
You have a Microsoft Power Bl dashboard.
You need to ensure that consumers of the dashboard can give you feedback that will be visible to the other consumers of the dashboard.
What should you use?
You need to create a Power BI theme that will be used in multiple reports. The theme will include corporate branding for font size, color, and bar chart formatting.
What should you do?
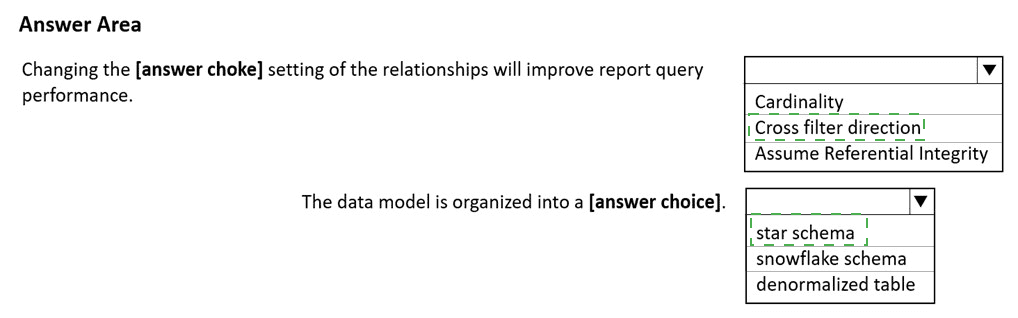
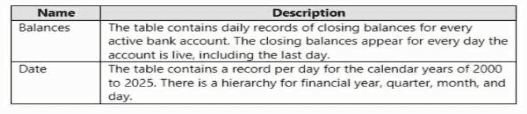
You have a Power BI imported dataset that contains the data model shown in the following exhibit.
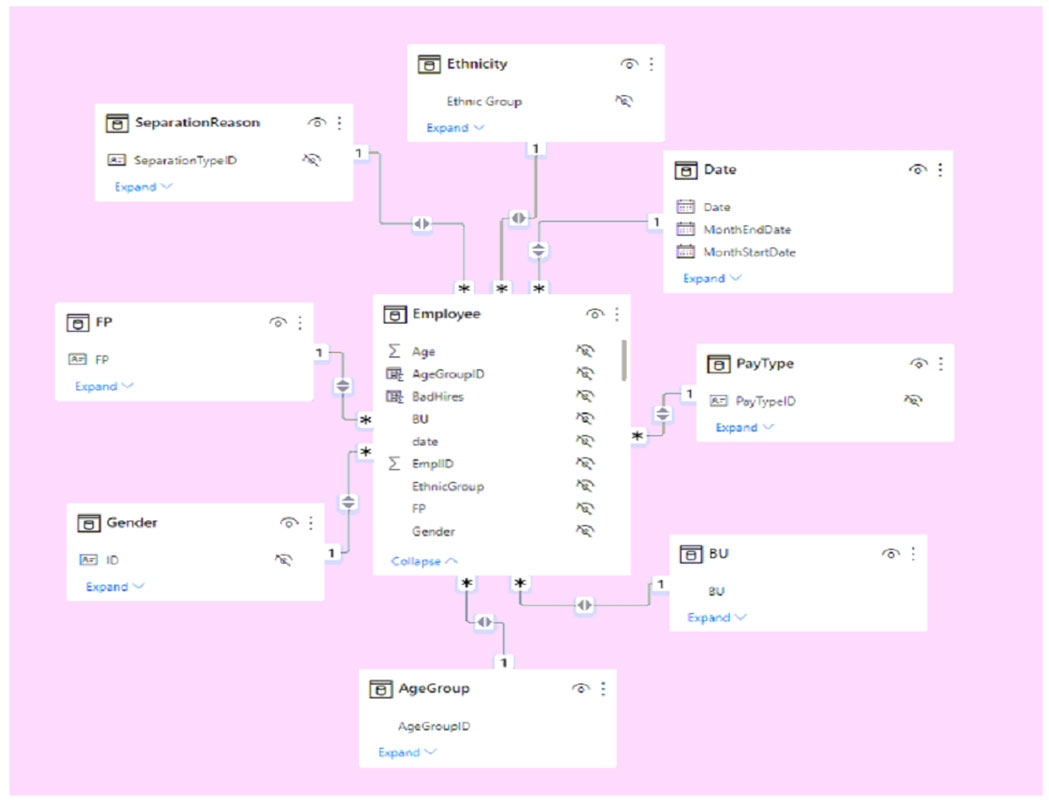
Use the drop-down menus to select the answer choice that completes each statement based on the information presented in the graphic.
NOTE: Each correct selection is worth one point.
You have a Power Bl semantic model that contains the following tables.
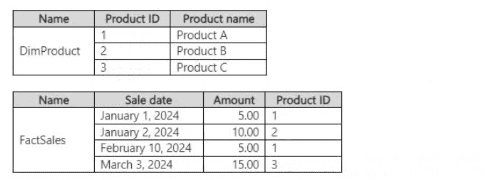
You need to define a relationship from FactSales to DimProduct. The solution must ensure the fastest DAX query performance.
Which cardinality should you use?
You have a Microsoft Excel file in a Microsoft OneDrive folder.
The file must be imported to a Power Bi dataset
You need to ensure that the dataset can be refreshed in powefbi.com.
Which two connectors can you use to connect to the file? Each correct answer presents a complete solution.
NOTE: Each correct selection is worth one point.
You have a Power Bl report.
You have the following tables.
You have the following DAX measure.


Vou have a Microsoft Power Bl Desktop report named Report! that uses an Azure SQL database as a data source. A user named User1 plans to create a report by using the same data source as Report1.
You need to simplify the connection to the data source for User1.
Which type of file should you create?
You have the Power Bl model shown in the following exhibit.
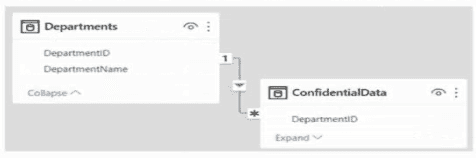
There are four departments in the Departments table.
You need to ensure that users can see the data of their respective department only.
What should you do?
You are creating a quick measure as shown in the following exhibit.
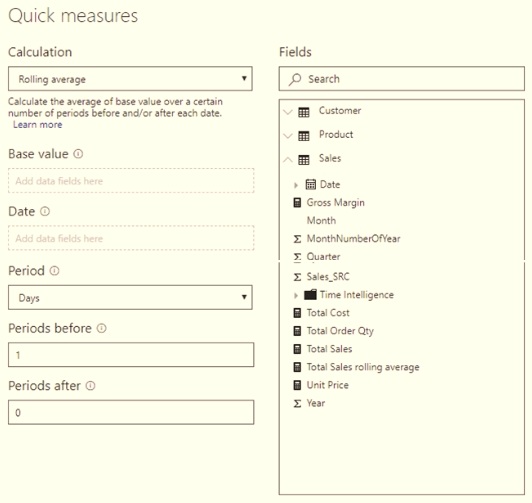
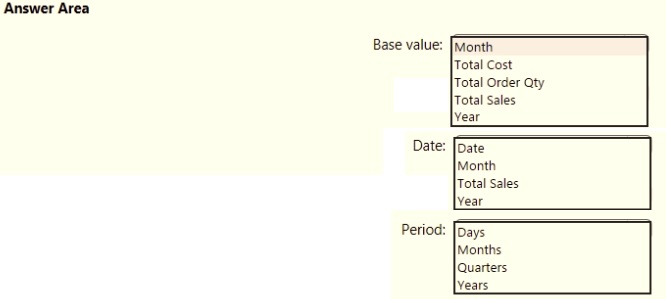
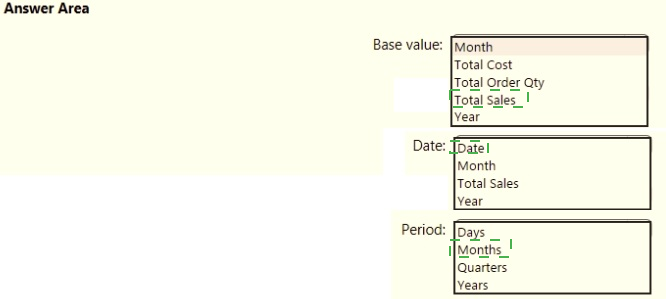
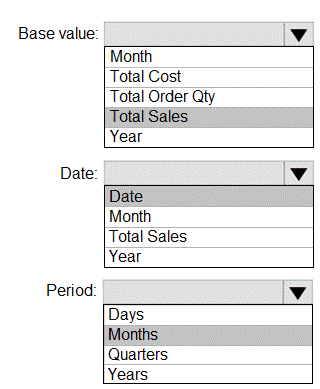
You need to create a monthly rolling average measure for Sales over time-How should you configure the quick measure calculation? To answer, select the appropriate options in the answer area.
NOTE: Each correct selection is worth one point.
You have two Power Bl reports named ReportA and ReportB that each uses a distinct color palette.
You are creating a Power Bl dashboard that will include two visuals from each report
You need to use a consistent dark theme for the dashboard. The solution must preserve the original colors of the reports.
Which two actions should you perform? Each correct answer presents part of the solution.
NOTE: Each correct selection is worth one point.
Adding an index key and normalizing casing in the data source would help resolve issues with undefined values and errors in a case-sensitive column. The index key can provide a unique identifier, and normalizing casing ensures consistency in the data, which would likely prevent the errors you encountered in the Power BI semantic model.
You have a Power BI data model that imports a date table and a sales table from an Azure SQL database data source. The sales table has the following date foreign keys.
•Due Date
•Order Date
•Delivery Date
You need to support the analysis of sales over time based on all three dates at the same time.
Solution: For each date foreign key, you add inactive relationships between the sales table and the date table.
Does this meet the goal?
You publish a semantic model to the Power Bl service. The semantic model contains a connection to an on-premises Microsoft SQL Server database.
You attempt to configure a scheduled refresh but cannot select the appropriate on-premises data gateway.
You confirm the following with the administrator of the gateway:
• You have the appropriate permissions to use the gateway.
• The data source was created on the gateway.
• The gateway has a status of Running.
What is the most likely reason the gateway is unavailable?
You have a semantic model named Model1.
You have a Power BI report named RPT1 that is connected to Model1. RPT1 contains a table visual named Table1 that shows the results of multiple measures.
You discover that the DAX query for Table1 runs slowly.
You need to identify which measure is slowing query performance.
What should you use?
You have a Q&A visual that displays information from a table named Carriers as shown in the following exhibit.
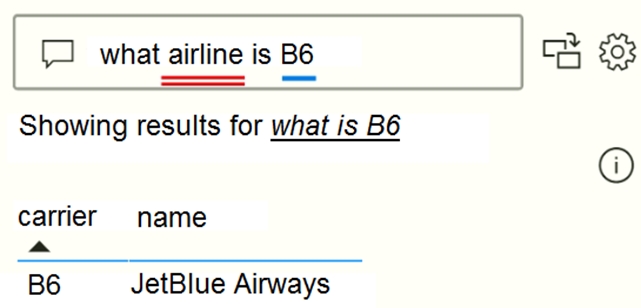
You need to ensure that users can ask questions by using the term airline or carrier. The solution must minimize changes to the data model.
What should you do?
