Analytics-DA-201 Salesforce Certified Tableau Data Analyst Free Practice Exam Questions (2026 Updated)
Prepare effectively for your Salesforce Analytics-DA-201 Salesforce Certified Tableau Data Analyst certification with our extensive collection of free, high-quality practice questions. Each question is designed to mirror the actual exam format and objectives, complete with comprehensive answers and detailed explanations. Our materials are regularly updated for 2026, ensuring you have the most current resources to build confidence and succeed on your first attempt.
You have the Mowing dashboard.
Which two elements are floating? Choose two.
You have a dashboard that contains confidential information about patients health. The data needs to always be up to date tor a team of healthcare workers How should you share me dashboard with the healthcare workers?
You have a line chart on a worksheet.
You want to add a comment to March 2020 as shown in the following visualization.
What should you do?
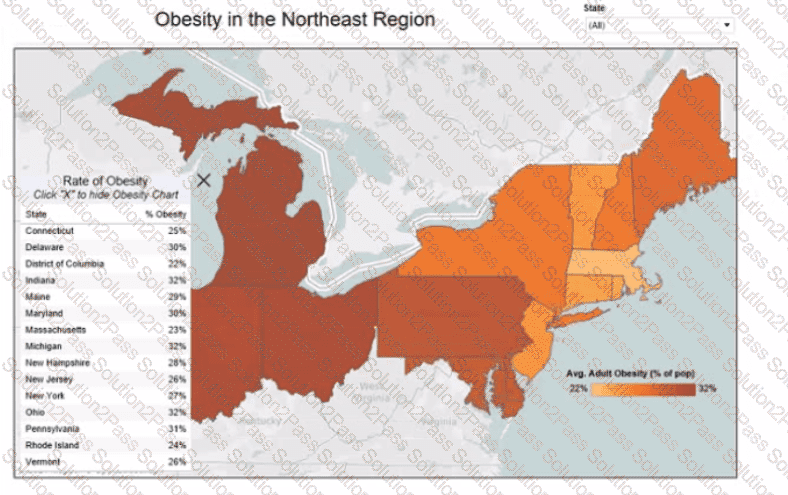
You have the following dataset.
Which Level of Detail (LOD) expression should you use to calculate tie grand total of all the regions?
You have the following dataset.
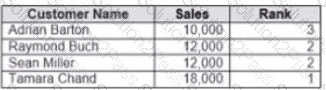
Yon need to calculate the ranking shown in the Rank field.
How should you complete the formula? (Use the dropdowns in the Answer Area to select the correct options to complete the formula ?


You are the owner of an alert.
You receive an email notification that the alert was suspended
From where can you resume the suspended alert?
A colleague provides you with access to a folder that contains the following files:
• Sates.csv
• Bookl.twb
• Sates.hyper
• Export.mdb
Which He contains an extract?
You publish a dashboard tut uses an attract. The extract refreshes every Monday at 10:00.
You need to ensure that the extract also refreshes on the last day of the month at 18:00.
What should you do?
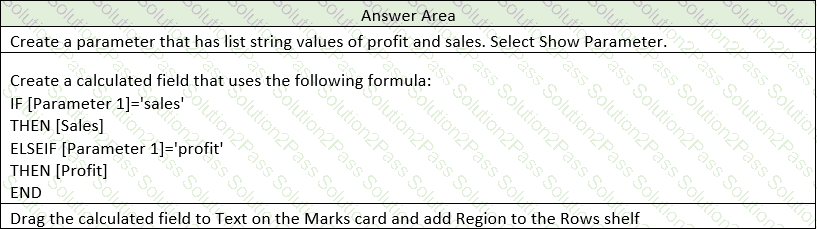
You have the following dataset.
You need to create the following worksheet.
The table must show either profit or sales based on the selection from the Parameter 1 menu.
Which three actions should you perform in orders
(Place the three correct options in order Use the arrows to move Options lo Answer Area Use Answer Area arrows to reorder the options)
 A screenshot of a computer
Description automatically generated
A screenshot of a computer
Description automatically generatedYou have the following box plot that shows the distribution of average profits made in every state by region.
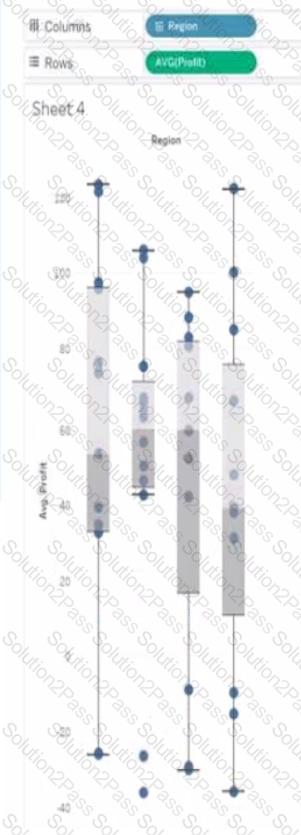
Which region has the smallest distribution of profits?
You plan to create a visualization that has a dual axis chart. The dual axis chart will contain a shape chart and a line chart will use the same measure named Population on the axis.
You need to configure be shapes to be much larger than the line.
What should you do?
You have the following line chart that shows the average sales by month.
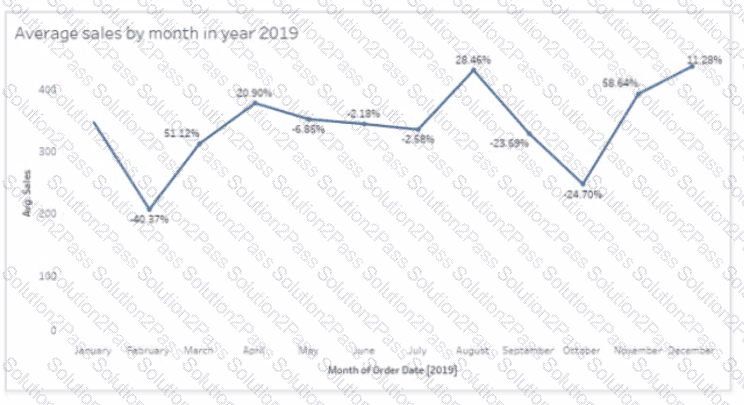
Which month had the biggest increase in swage sales compared to me previous month in 2019?
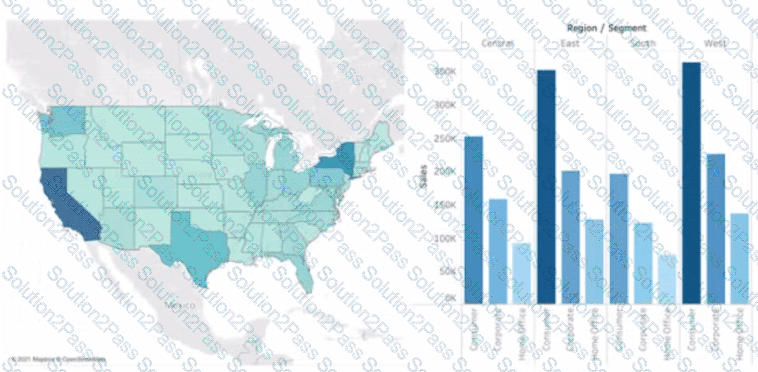
You have a database that includes field named sales, City and Region.
You have the following chart that shows the number of sales made in different cities.
You want to dynamically show the corresponding region when users hover their mouse over any of the bars.
What should you do?
You have the following tiled dashboard that has one sheet.
You want to replace the sheet with Sheet2.
What should you do?
You have the following dashboard that contains two visualizations.
You want to show only one visualization at time. Users must be able to switch between visualizations.
What should you me?
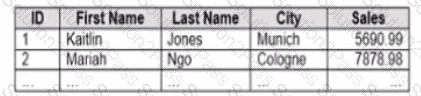
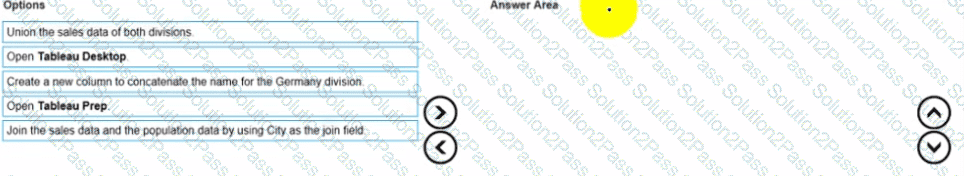
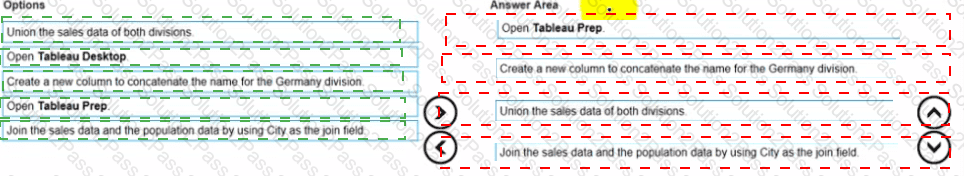
You company has two divisions located in the United States and Germany Bach division has a separate database. The following is a sample of the sales data for the division in the United States.
The following is a sample of the sales data for me division in Germany.
You have population data in a file named Populatio.csv. the following is a sample of the data.
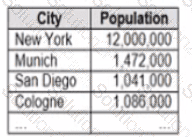
You plan to create a visualization that ml show tie sales per capita for each salesperson Each salesperson must be identified by identified by their full name.
You need to prepare the data to support the planned visualization. The data source must support being published .
Which four actions should you perform in order?
(Place the four correct options n order Use the arrows to move Options to Answer Area arrows to re-order the options.
Use Answer Area arrows to re-order the options)
You want to add a comment to March 2020 as shown in the following visualization.
You have the following sets in a Tableau workbook
• Top N Customers
• Customers of 2020
• Top N Products
• Sellers of 2020
Which two sets can you combine? Choose two
You want to connect a Tableau workbook to a dataset in a Microsoft Excel spreadsheet.
What should you do from Tableau Desktop?
A Data Analyst has a data source that has two tables named Table1 and Table2. Table1 is the primary table and Table2 is the secondary table.
The analyst wants to combine the tables by using Tableau Prep. The combined table must include only values from Table1 that do not match any values in Table2. The field values from Table2 must appear as null values.
Which type of join should the analyst use?
You have the following dataset.
Which grouping option should you use m Tableau Prep to group al five names automatically?
