TDA-C01 Tableau Certified Data Analyst Exam Free Practice Exam Questions (2026 Updated)
Prepare effectively for your Tableau TDA-C01 Tableau Certified Data Analyst Exam certification with our extensive collection of free, high-quality practice questions. Each question is designed to mirror the actual exam format and objectives, complete with comprehensive answers and detailed explanations. Our materials are regularly updated for 2026, ensuring you have the most current resources to build confidence and succeed on your first attempt.
Open the link to Book1 found on the desktop. Open Disciplines worksheet.
Filter the table to show the Top 10 NOC based on the number of medals won.
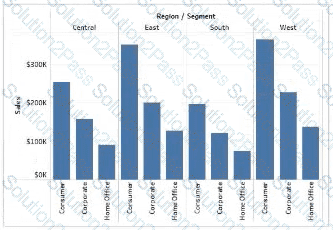
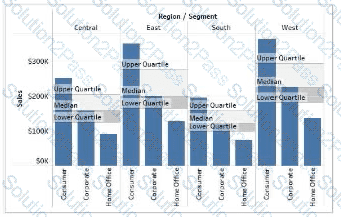
Open the link to Book1 found on the desktop. Open the Line worksheet.
Modify the chart to show only main and max values of both measures in each region.
Open the Link to Book1 found on the desktop. Open Map worksheet and use Superstore data source.
Create a filed map to show the distribution of total Sales by State across the United States.
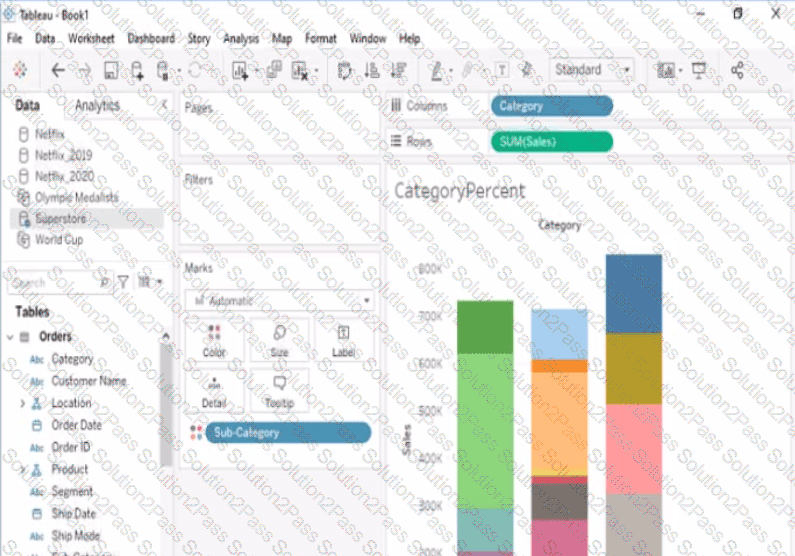
Open the link to Book1 found on the desktop. Open the CategoryPercentage worksheet.
Modify the bar chart show the percentage of sales for each Subcategory within every Category. The total percentage for every Category must be 100%.
Open the link to Book1 found on the desktop. Open SalesVSProfit worksheet.
Add a distribution band on Profit to show the standard deviation from- 1 to 1.
Open the link to Book1 found on the desktop. Open the sales dashboard.
Add the Sales by State sheet in a Show/Hide button to the right side of the dashboard.
A Data Analyst has the following bar chart.
The analyst wants the chart to appear as shown in the following exhibit.
What should the analyst add?
You have the following dataset
You need to create the following visualization.
Which quick table calculation should you drag to Text on the Marks card?
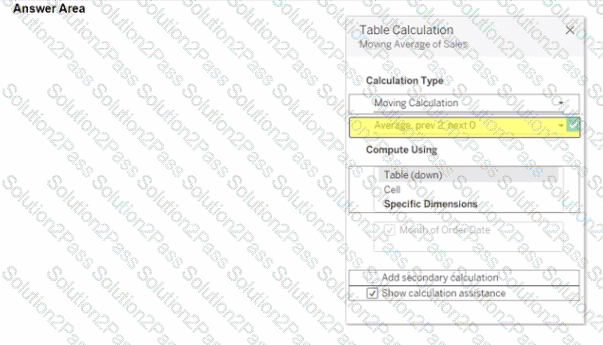
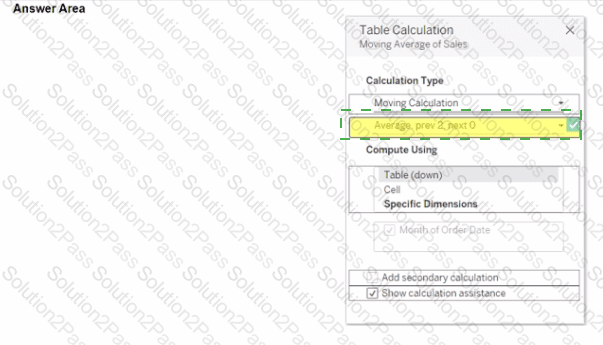
You use a quick table calculation lo calculate the moving average of a measure named Sales.
You need to calculate the moving averages of the last three years.
Which setting should you change in the Table Calculation dialog box? {Click the appropriate Option in the Answer Area)
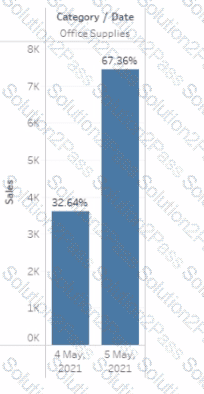
A Data Analyst has the following chart that shows the cumulative volume of sales from various dates.
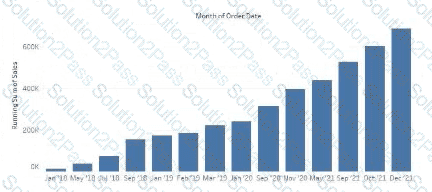
The analyst wants the months to appear as shown in the following chart.
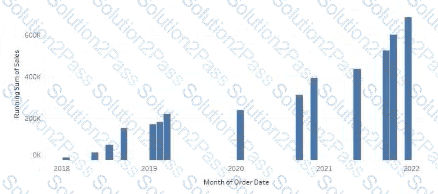
What should the analyst do?
When using a Show/Hide button in Tableau, what happens if the object is in a Tiled layout container?
When should a Data Analyst use a Treemap in Tableau?
A Data Analyst has the following chart that shows the sum of sales made in different cities.
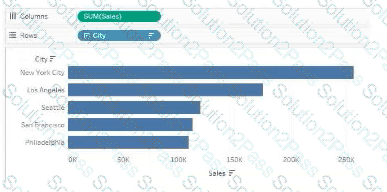
The analyst wants to show the average sale amount for a city when users hover their mouse over any of the bars.
What should the analyst do?
You have the following dashboard.
Currently the map is used as a filter that affects the data on the otter sheets of the dashboard
You need to configure the dashboard to ensure that selecting a data point on the map only tillers the Detail table
What should you do?
You have the following dataset.
You plan to create a dashboard that will be filtered to show only data that is relevant to a specific Tableau user based on the Tableau_User_Name field You need to create a boolean calculated field to place on the data source finer Which formula should you use for the filter?
A Data Analyst has a website that displays data in a table format.
The analyst wants to connect to the data of the website by using the least amount of effort.
What should the analyst use to connect to the data?
