TDA-C01 Tableau Certified Data Analyst Exam Free Practice Exam Questions (2026 Updated)
Prepare effectively for your Tableau TDA-C01 Tableau Certified Data Analyst Exam certification with our extensive collection of free, high-quality practice questions. Each question is designed to mirror the actual exam format and objectives, complete with comprehensive answers and detailed explanations. Our materials are regularly updated for 2026, ensuring you have the most current resources to build confidence and succeed on your first attempt.
A Data Analyst has the following dataset:
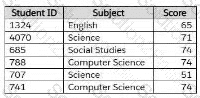
The analyst wants to create a new calculated dimension field named Category that meets the following conditions:
When Subject is Computer Science or Science, the Category must be Sciences.
When Subject is English or Social Studies, the Category must be Humanities.
Which two logical functions achieve this goal? (Choose two.)
A Data Analyst has created a Tableau Prep flow that is ready to be used. The output will be used by a colleague to build a dashboard on Tableau Cloud or Tableau Server.
Where should the analyst output the data to?
You have a Tableau workbook that has a live data source. The data source connects to a Microsoft SQL Server database. Only the users in your department can access the database.
You plan to publish the workbook to a Tableau Server site named Public. All the users in your company can access Public.
What are two ways to ensure that all the users can view the worksheets in the workbook? Choose two.
You have the following dashboard that contains two sheets.
You want to minimize the whitespace between the sheets.
What should you configure?
A Data Analyst has the following two tables named Orders and Returns.
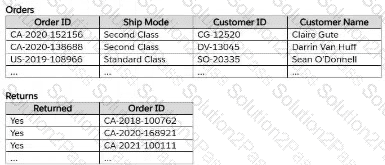
The analyst needs to get the Customer ID and Customer Name for only the orders that were returned. Orders will be the leading table.
Which type of join should the analyst perform in Tableau Prep?
You have a workbook that connects to a database. The database requires authentication.
You plan to publish the workbook and schedule a daily refresh of the data.
Which two conditions must be met to schedule the refresh? Choose two.
You want to create the following table in a view.
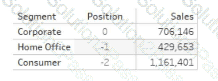
Which function should you use to create the Position column?
You are developing a data source in Tableau Prep.
You have two tables named Orders and Employees.
The Orders table was created in 2019 and contains the following columns.
The Employees table contains all the employee information for the various sales teams in the sales department and contains the following columns
You want to prepare the data so that you can analyze sales trends over time for every sales team.
Which three actions should you perform in order? (Place the three correct options in order. Use the arrows to move Options to Answer Area. Use Answer Area arrows to re-order the options.)
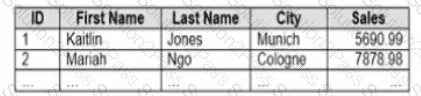
You company has two divisions located in the United States and Germany Bach division has a separate database. The following is a sample of the sales data for the division in the United States.
The following is a sample of the sales data for me division in Germany.
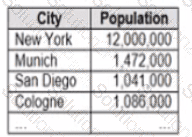
You have population data in a file named Populatio.csv. the following is a sample of the data.
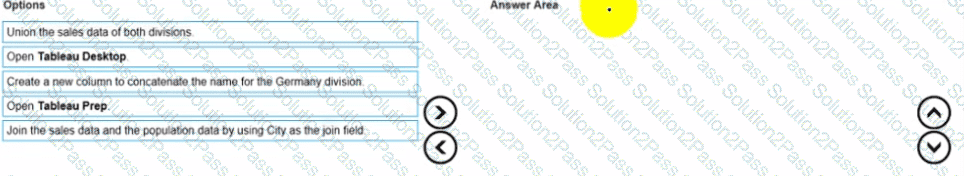
You plan to create a visualization that ml show tie sales per capita for each salesperson Each salesperson must be identified by identified by their full name.
You need to prepare the data to support the planned visualization. The data source must support being published .
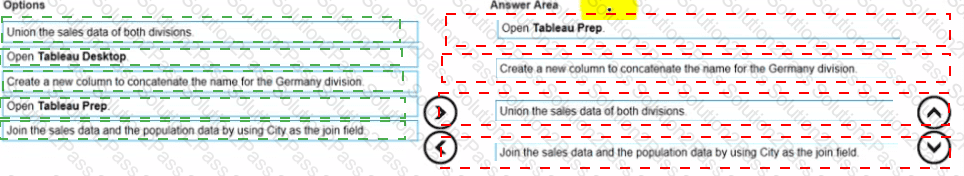
Which four actions should you perform in order?
(Place the four correct options n order Use the arrows to move Options to Answer Area arrows to re-order the options.
Use Answer Area arrows to re-order the options)
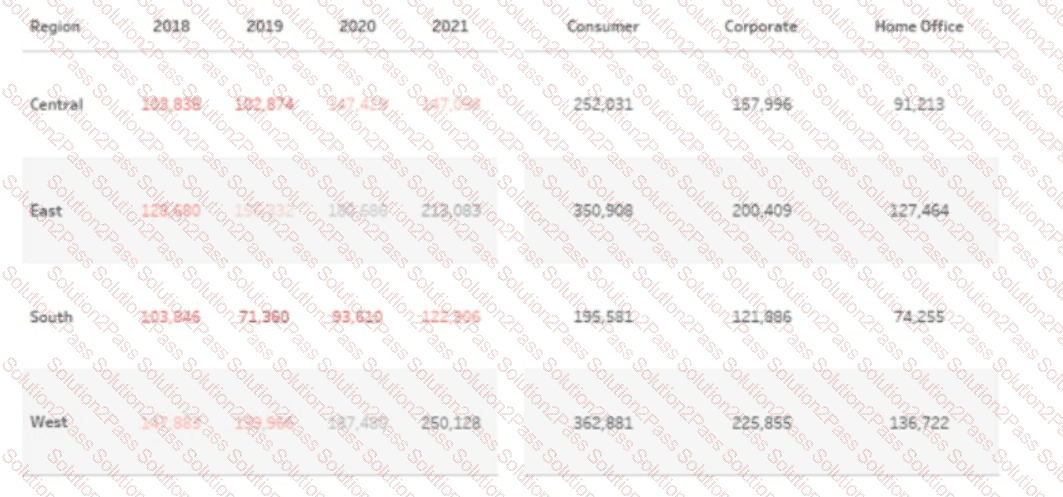
You have the following box plot that shows the distribution of average profits made in every state by region.
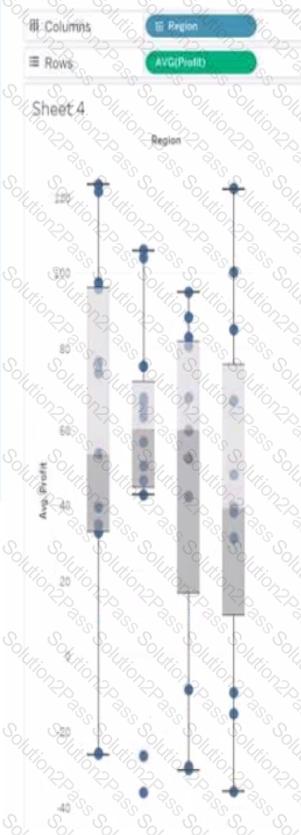
Which region has the smallest distribution of profits?
You have the following tiled dashboard that has one sheet.
You want to replace the sheet with Sheet2.
What should you do?
You publish a dashboard tut uses an attract. The extract refreshes every Monday at 10:00.
You need to ensure that the extract also refreshes on the last day of the month at 18:00.
What should you do?
You have the following dataset.
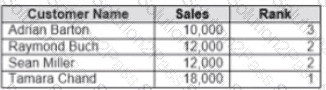
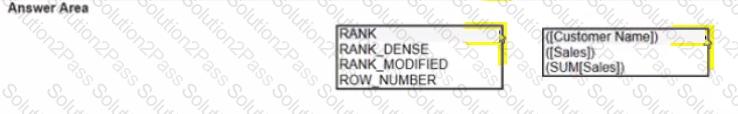
Yon need to calculate the ranking shown in the Rank field.
How should you complete the formula? (Use the dropdowns in the Answer Area to select the correct options to complete the formula ?

You have a dashboard that contains confidential information about patients health. The data needs to always be up to date tor a team of healthcare workers How should you share me dashboard with the healthcare workers?
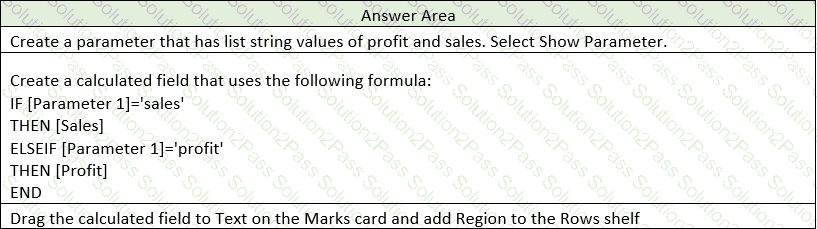
You have the following dataset.
You need to create the following worksheet.
The table must show either profit or sales based on the selection from the Parameter 1 menu.
Which three actions should you perform in orders
(Place the three correct options in order Use the arrows to move Options lo Answer Area Use Answer Area arrows to reorder the options)
 A screenshot of a computer
Description automatically generated
A screenshot of a computer
Description automatically generatedYou plan to create a visualization that has a dual axis chart. The dual axis chart will contain a shape chart and a line chart will use the same measure named Population on the axis.
You need to configure be shapes to be much larger than the line.
What should you do?
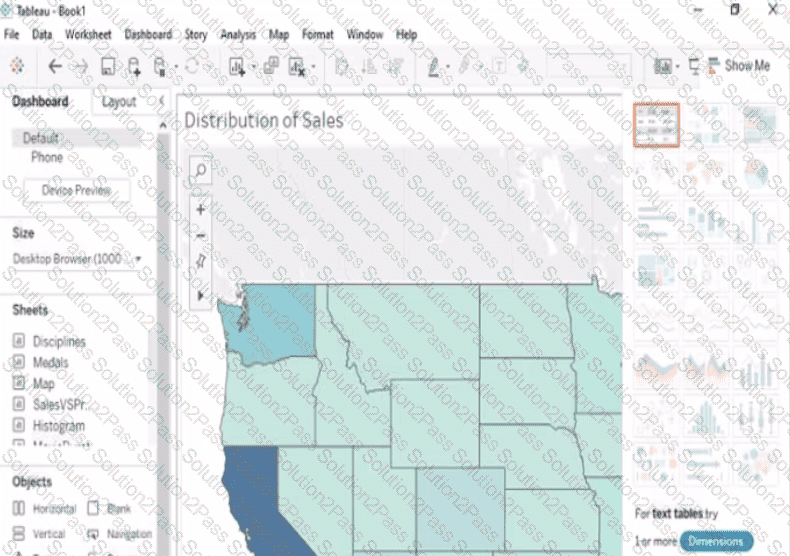
Open the link to Book1 found on the desktop. Use the Superstore data source.
Split the Customer Name field into two fields named First Name and Last Name.
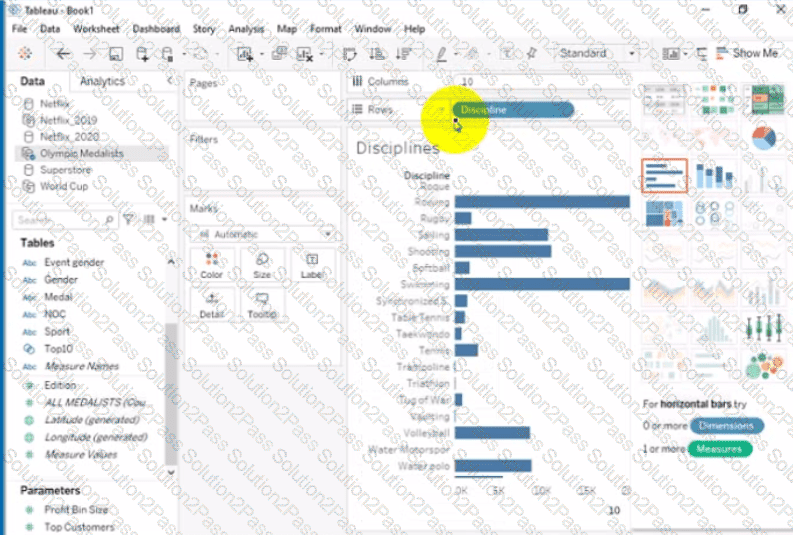
Open the link to Book1 found on the desktop. Open Disciplines worksheet.
Filter the table to show the members of the Top10 set and the members of the Bottom10 set. There should be a total of 20 rows.
Open the link to Book1 found on the desktop. Open the Movie Durations worksheet.
Replace the existing data source with the Netflix_2019 data source.
Open the link to Book1 found on the desktop. Open the Histogram worksheet and use the Superstone data source.
Create a histogram on the Quantity field by using bin size of 3.
