TDS-C01 Tableau Desktop Specialist Free Practice Exam Questions (2026 Updated)
Prepare effectively for your Tableau TDS-C01 Tableau Desktop Specialist certification with our extensive collection of free, high-quality practice questions. Each question is designed to mirror the actual exam format and objectives, complete with comprehensive answers and detailed explanations. Our materials are regularly updated for 2026, ensuring you have the most current resources to build confidence and succeed on your first attempt.
Which two analytics options are available for a scatter plot view? Choose two.
Which two filter modes can you use with continuous filters? Choose two.
You are creating a combined axis chart.
Where should you drag the second measure after dragging the first measure to the Rows shelf?
Which of the following sets would you use to compare the members?
______________ refers to the level of detail for a piece of data, wherever you are looking.
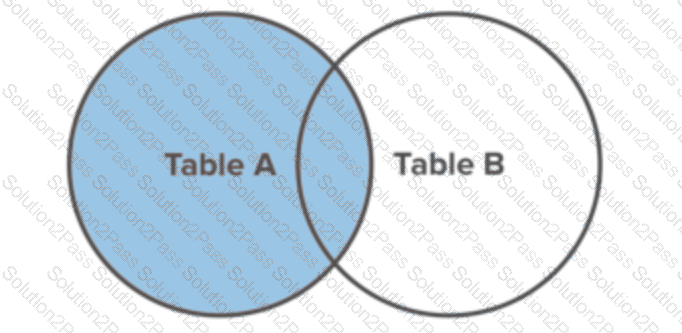
True or False: A LEFT JOIN or INNER JOIN creates a row each time the join criteria is satisfied, which can result in duplicate rows. One way to avoid this is to use data blending instead.
Which of the following is a valid way to create Sets in Tableau?
While borders and background colors let you visually highlight items on a dashboard, _________ lets you precisely space items.
Larger image
What is this entire view referred to as in Tableau?
Suppose you create a bar chart by dragging a dimension to the Column shelf and a measure to the Rows shelf. Which of the following would create a stacked bar chart?
Which of the following can you use to create a Histogram?
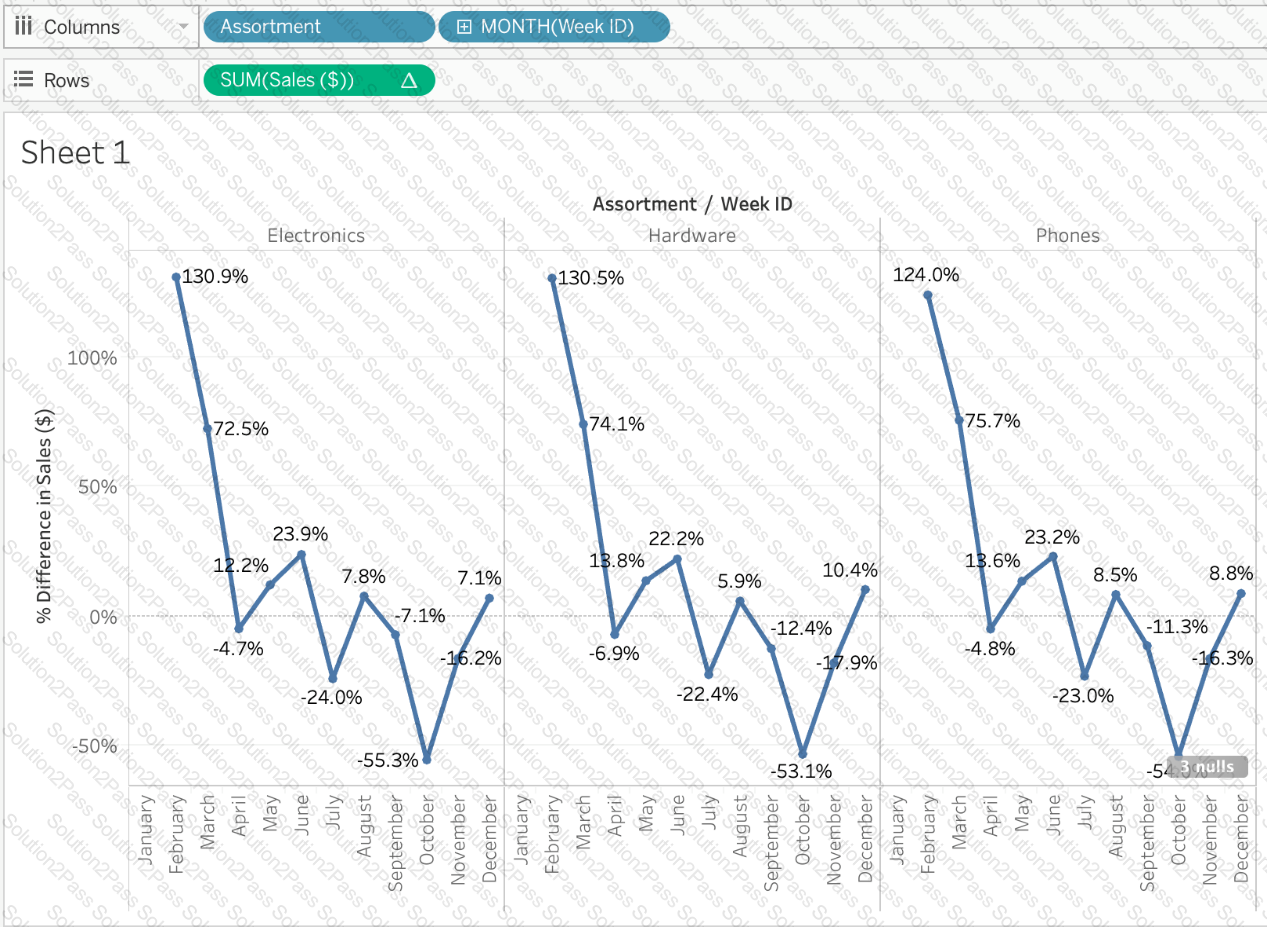
Using the Time Series Table, create a Line chart showing the Monthly Year over Year Growth for the Sales, broken down by Assortment. For the Electronics assortment, which Month had the most NEGATIVE value of Year over Year Growth?
Using the Time Series Table, create a Line chart showing the Monthly Year over Year Growth for the Sales, broken down by Assortment. For the Electronics assortment, which Month had the most NEGATIVE value of Year over Year Growth?
When creating an extract, what are three options for specifying how much data to extract? Choose three.
Which action describes the process for changing a measure so that it automatically aggregates an average instead of a sum?
